
1
CS553 Lecture Profile-Guided Optimizations 2
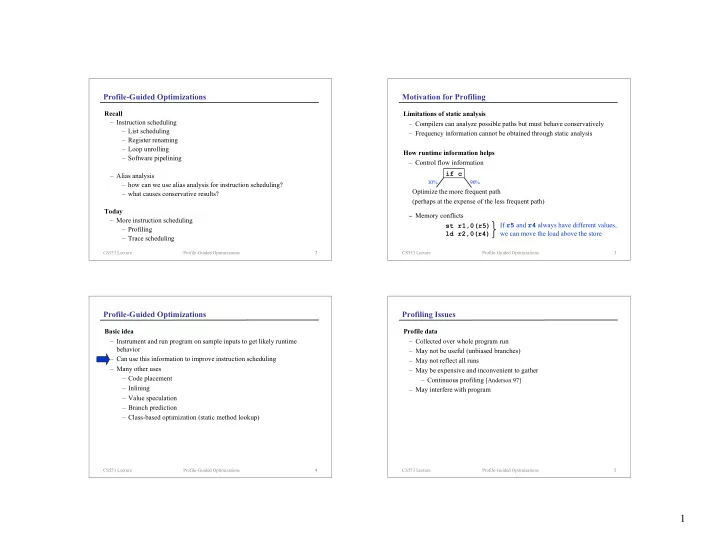
Profile-Guided Optimizations
Recall– Instruction scheduling – List scheduling – Register renaming – Loop unrolling – Software pipelining – Alias analysis – how can we use alias analysis for instruction scheduling? – what causes conservative results?
Today– More instruction scheduling – Profiling – Trace scheduling
CS553 Lecture Profile-Guided Optimizations 3
Motivation for Profiling
Limitations of static analysis– Compilers can analyze possible paths but must behave conservatively – Frequency information cannot be obtained through static analysis
How runtime information helps– Control flow information Optimize the more frequent path (perhaps at the expense of the less frequent path) − Memory conflicts if c
90% 10%
st r1,0(r5) ld r2,0(r4) If r5 and r4 always have different values, we can move the load above the store
CS553 Lecture Profile-Guided Optimizations 4
Profile-Guided Optimizations
Basic idea– Instrument and run program on sample inputs to get likely runtime behavior – Can use this information to improve instruction scheduling – Many other uses – Code placement – Inlining – Value speculation – Branch prediction – Class-based optimization (static method lookup)
CS553 Lecture Profile-Guided Optimizations 5
Profiling Issues
Profile data– Collected over whole program run – May not be useful (unbiased branches) – May not reflect all runs – May be expensive and inconvenient to gather – Continuous profiling [Anderson 97] – May interfere with program