
SLIDE 1
1
1
Recap of: The IT Innovation Ecosystem
Ed Lazowska IT & Public Policy Autumn 2004 Lessons from the “Tire Tracks Diagram”
2
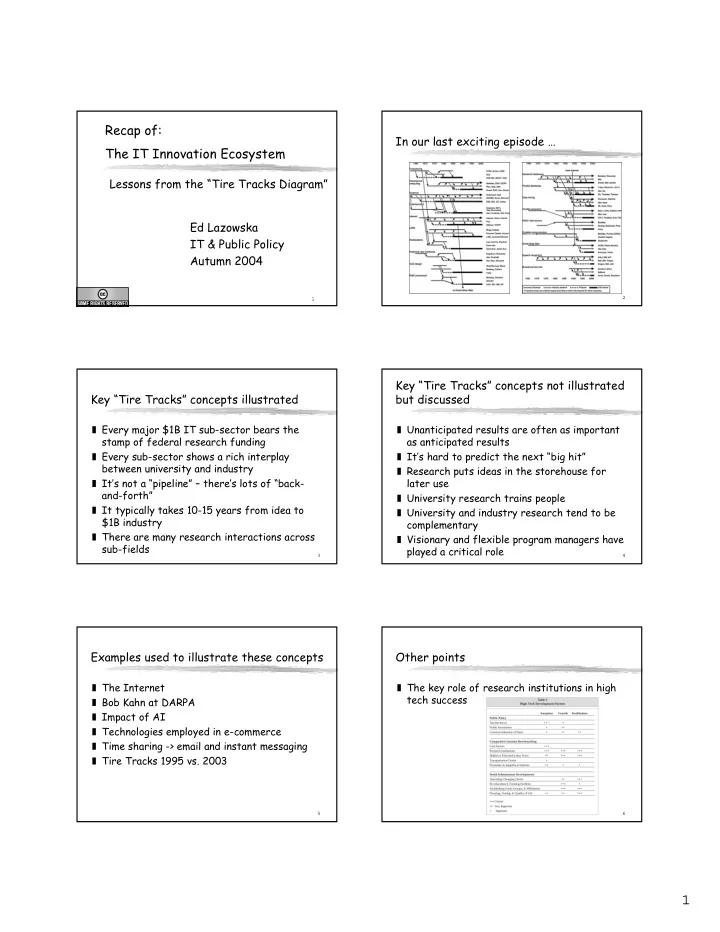
In our last exciting episode …
3
Key “Tire Tracks” concepts illustrated
❚ Every major $1B IT sub-sector bears the stamp of federal research funding ❚ Every sub-sector shows a rich interplay between university and industry ❚ It’s not a “pipeline” – there’s lots of “back- and-forth” ❚ It typically takes 10-15 years from idea to $1B industry ❚ There are many research interactions across sub-fields
4
Key “Tire Tracks” concepts not illustrated but discussed
❚ Unanticipated results are often as important as anticipated results ❚ It’s hard to predict the next “big hit” ❚ Research puts ideas in the storehouse for later use ❚ University research trains people ❚ University and industry research tend to be complementary ❚ Visionary and flexible program managers have played a critical role
5
Examples used to illustrate these concepts
❚ The Internet ❚ Bob Kahn at DARPA ❚ Impact of AI ❚ Technologies employed in e-commerce ❚ Time sharing -> email and instant messaging ❚ Tire Tracks 1995 vs. 2003
6