1
play

1 Original Frame Rate Original Frame Rate Instantaneous Frame Rate - PDF document

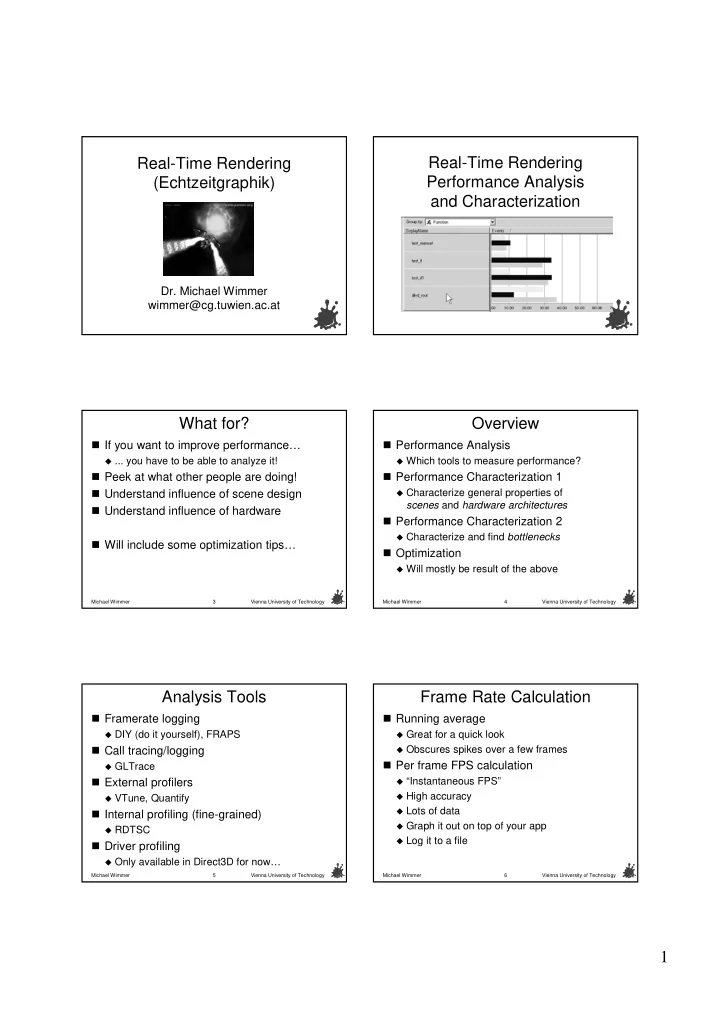
Real- -Time Rendering Time Rendering Real- Real -Time Rendering Time Rendering Real Performance Analysis (Echtzeitgraphik ( Echtzeitgraphik) ) Performance Analysis and Characterization and Characterization Dr. Michael Wimmer Dr.


  1. Real- -Time Rendering Time Rendering Real- Real -Time Rendering Time Rendering Real Performance Analysis (Echtzeitgraphik ( Echtzeitgraphik) ) Performance Analysis and Characterization and Characterization Dr. Michael Wimmer Dr. Michael Wimmer wimmer@cg.tuwien.ac.at wimmer@cg.tuwien.ac.at What for? What for? Overview Overview � � If you want to improve performance � Performance Analysis � If you want to improve performance… … Performance Analysis � ... you have to be able to analyze it! ... you have to be able to analyze it! � Which tools to measure performance? Which tools to measure performance? � � � � Peek at what other people are doing! � � Performance Characterization 1 Peek at what other people are doing! Performance Characterization 1 � Understand influence of scene design � � Characterize general properties of Characterize general properties of Understand influence of scene design � scenes and and hardware architectures hardware architectures scenes � Understand influence of hardware � Understand influence of hardware � � Performance Characterization 2 Performance Characterization 2 � Characterize and find Characterize and find bottlenecks bottlenecks � � Will include some optimization tips � Will include some optimization tips… … � � Optimization Optimization � Will mostly be result of the above Will mostly be result of the above � Michael Wimmer 3 Vienna University of Technology Michael Wimmer 4 Vienna University of Technology Analysis Tools Analysis Tools Frame Rate Calculation Frame Rate Calculation � � Framerate � Running average � Framerate logging logging Running average � DIY (do it yourself), FRAPS DIY (do it yourself), FRAPS � Great for a quick look Great for a quick look � � � Call tracing/logging � � Obscures spikes over a few frames Obscures spikes over a few frames Call tracing/logging � � � Per frame FPS calculation Per frame FPS calculation � GLTrace GLTrace � � External profilers � � “ “Instantaneous FPS Instantaneous FPS” ” External profilers � � High accuracy High accuracy � � � VTune VTune, Quantify , Quantify � Lots of data Lots of data � � Internal profiling (fine � Internal profiling (fine- -grained) grained) � Graph it out on top of your app Graph it out on top of your app � � RDTSC RDTSC � � Log it to a file Log it to a file � � Driver profiling � Driver profiling � Only available in Direct3D for now Only available in Direct3D for now… … � Michael Wimmer 5 Vienna University of Technology Michael Wimmer 6 Vienna University of Technology 1

  2. Original Frame Rate Original Frame Rate Instantaneous Frame Rate Instantaneous Frame Rate 60 60 50 50 Average looks pretty good Average looks pretty good In reality, a little noisy In reality, a little noisy 40 40 FPS FPS FPS FPS 30 30 20 20 10 10 0 0 1 1 n n Frames Frames Frames Frames Michael Wimmer 7 Vienna University of Technology Michael Wimmer 8 Vienna University of Technology FRAPS FRAPS GLTrace GLTrace � � Displays frame rate for � Can log � Displays frame rate for any any OpenGL app OpenGL app Can log all all OpenGL calls for any app OpenGL calls for any app � � Gives call counts � by intercepting calls to opengl32.dll by intercepting calls to opengl32.dll Gives call counts � � Average over last few frames � Average over last few frames � � Allows reverse engineering (also of models!) Allows reverse engineering (also of models!) � Has file logging � Has file logging � Cheating � Cheating… … Application Application � Small � Small (wireframe wireframe) ) ( performance hit performance hit � See VU � GLTrace- GLTrace - See VU- -page for page for gltrace.txt gltrace.txt � � Good for quick Good for quick opengl32.dll opengl32.dll link link… … comparisons comparisons � Can use trace for � Can use trace for � � www.fraps.com original original- - www.fraps.com simulation simulation! ! opengl32.dll opengl32.dll Michael Wimmer 9 Vienna University of Technology Michael Wimmer 10 Vienna University of Technology Example Trace (1338 Frames) Example Trace (1338 Frames) External Profiling – External Profiling – Sampling Sampling 738541 738541 glVertex3fv glVertex3fv � � Based on Based on sampling sampling at regular intervals 728673 728673 glTexCoord2fv glTexCoord2fv 224682 224682 glColor4fv glColor4fv � � Example: Intel Example: Intel VTune VTune 206474 206474 glNormal3fv glNormal3fv 201074 201074 glCallList glCallList 180574 180574 glBegin glBegin � Expensive, only Intel processors � Expensive, only Intel processors 180574 180574 glEnd glEnd � � How much time is spent in 168356 168356 glBindTextureEXT glBindTextureEXT How much time is spent in… … 22659 22659 glEnable glEnable 21150 21150 glMaterialfv glMaterialfv � OS OS � 20557 20557 glDisable glDisable 9622 9622 glShadeModel glShadeModel � Other applications Other applications � 5706 5706 glPopMatrix glPopMatrix 5706 5706 glPushMatrix glPushMatrix � Driver (kernel Driver (kernel- - and user and user- -mode) mode) � 4216 4216 glBlendFunc glBlendFunc Vertices 4326.8 Vertices 4326.8 3478 3478 glMatrixMode glMatrixMode � Application (which function, which line of code) � Application (which function, which line of code) 3164 3164 glLoadIdentity glLoadIdentity Triangles (3D) Triangles (3D) 2535.3 2535.3 � � Pros Pros 3010 3010 glDepthMask glDepthMask Triangles (2D) Triangles (2D) 939.0 939.0 2546 2546 glAlphaFunc glAlphaFunc 2546 2546 glMultMatrixf glMultMatrixf � works with any program, no rebuild necessary works with any program, no rebuild necessary � Fragments Fragments 1353892 1353892 2105 2105 glTexEnvf glTexEnvf 1676 1676 glEndList glEndList � no slowdowns no slowdowns � Image Image 1024× 1024 ×768 768 1676 1676 glNewList glNewList Michael Wimmer 11 Vienna University of Technology Michael Wimmer 12 Vienna University of Technology 2

  3. VTune VTune External Profiling External Profiling – – Instrumentation Instrumentation � � Inserts logging directly into code Inserts logging directly into code � � Example: Rational Quantify Example: Rational Quantify � Pros � Pros � � Very accurate Very accurate � True call list and call graph True call list and call graph � � Cons � Cons � Need to rebuild code Need to rebuild code � � Really slows down execution � Really slows down execution � So slow, it invalidates all off So slow, it invalidates all off- -CPU interaction CPU interaction � � Example: main memory, GPU Example: main memory, GPU � Michael Wimmer 13 Vienna University of Technology Michael Wimmer 14 Vienna University of Technology Quantify Quantify Internal Profiling – Internal Profiling – RDTSC RDTSC � Current clock cycle counter � Current clock cycle counter � � Fine Fine- -grained timing (microseconds) grained timing (microseconds) � Calibrate using � Calibrate using GetTickCount GetTickCount() () � � Take into account overhead of Take into account overhead of rdtsc rdtsc itself! itself! � � Warm up caches (for tight loops) Warm up caches (for tight loops) Michael Wimmer 15 Vienna University of Technology Michael Wimmer 16 Vienna University of Technology Profiling – Profiling – Multitasking effects Multitasking effects Profiling: Seeing Half the Picture Profiling: Seeing Half the Picture � � Be aware of multitasking! Win2K examples: � Profiler runs on the CPU � Be aware of multitasking! Win2K examples: Profiler runs on the CPU Clock tick every 10 ms � � scheduler called � � GPU is a black box � Clock tick every 10 ms scheduler called GPU is a black box � � Thread quantum ~60 ms for foreground apps Thread quantum ~60 ms for foreground apps � � � > 1000 interrupts per clock tick! > 1000 interrupts per clock tick! Main Memory (MM) Main Memory (MM) � Accuracy Accuracy not not better than 1 ms for longer runs better than 1 ms for longer runs � � Consider using higher priority for timing � Consider using higher priority for timing Application Application SetPriorityClass(hProcess SetPriorityClass(hProcess, , Chipset / Chipset / CPU GPU GPU CPU Memory Controller Memory Controller REALTIME_PRIORITY_CLASS); REALTIME_PRIORITY_CLASS); SetThreadPriority(hThread, SetThreadPriority(hThread , THREAD_PRIORITY_TIME_CRITICAL); THREAD_PRIORITY_TIME_CRITICAL); VMM VMM � Beware thread starvation! Beware thread starvation! � Michael Wimmer 17 Vienna University of Technology Michael Wimmer 18 Vienna University of Technology 3

Download Presentation
Download Policy: The content available on the website is offered to you 'AS IS' for your personal information and use only. It cannot be commercialized, licensed, or distributed on other websites without prior consent from the author. To download a presentation, simply click this link. If you encounter any difficulties during the download process, it's possible that the publisher has removed the file from their server.

Recommend


More recommend