1 Models for population structure Models for population structure - - PDF document

1
SMART_READER_LITE
LIVE PREVIEW

1 Models for population structure Models for population structure - - PDF document

Outline Population heterogeneity, structure, Introduction: Heterogeneity and population structure Models for population structure and mixing Structure example: rabies in space Models for heterogeneity Jamie Lloyd-Smith individual


slide-1
SLIDE 1

1

Population heterogeneity, structure, and mixing

Jamie Lloyd-Smith Center for Infectious Disease Dynamics Pennsylvania State University

Outline

Introduction: Heterogeneity and population structure Models for population structure Structure example: rabies in space Models for heterogeneity

  • individual heterogeneity and superspreaders
  • group-level heterogeneity

Population structure and mixing mechanisms Pair formation and STD transmission

Heterogeneity and structure – what’s the difference?

Tough to define, but roughly… Heterogeneity describes differences among individuals or groups in a population. Population structure describes deviations from random mixing in a population, due to spatial or social factors. The language gets confusing:

  • models that include heterogeneity in host age are called

“age-structured”.

  • models that include spatial structure where model parameters

differ through space are called “spatially heterogeneous”.

Modelling heterogeneity

Break population into sub-groups, each

  • f which is homogeneous.

(often assume that all groups mix randomly) Allow continuous variation among individuals. Individual-level heterogeneity Group-level heterogeneity and multi-group models However, epidemiological traits of each host individual are due to a complex blend of host, pathogen, and environmental factors, and often can’t be neatly divided into groups (or predicted in advance).

Models for population structure

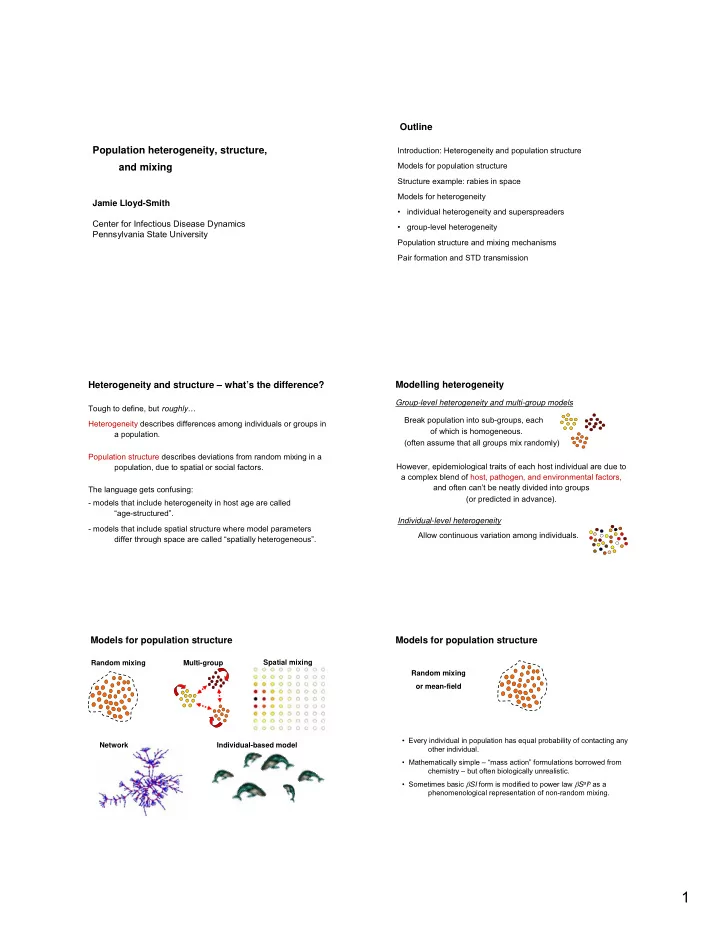
Random mixing Multi-group Spatial mixing Network Individual-based model

Models for population structure

Random mixing

  • r mean-field
  • Every individual in population has equal probability of contacting any
  • ther individual.
  • Mathematically simple – “mass action” formulations borrowed from

chemistry – but often biologically unrealistic.

  • Sometimes basic βSI form is modified to power law βSaIb as a

phenomenological representation of non-random mixing.

slide-2
SLIDE 2

2

Models for population structure

Multi-group

  • r metapopulation
  • Divides population into multiple discrete groupings, based on spatial or

social differences.

  • To model transmission, need contact matrix or Who Acquires Infection

From Whom (WAIFW) matrix: βij = transmission rate from infectious individual in group i to susceptible in group j

  • Or use only within-group transmission (so βij =0 when i≠j), and

explicitly model movement among groups.

Models for population structure

Spatial mixing

  • Used when individuals are distributed (roughly) evenly in space.
  • Can model many ways:
  • continuous space models (e.g. reaction-diffusion or contact kernel)
  • individuals as points on a lattice
  • patch models (metapopulation with spatial mixing)
  • Used to study travelling waves, spatial control programs, influences of

restricted mixing on disease invasion and persistence

Models for population structure

Social network

  • Precise representation of contact structure within a population
  • “Nodes” are individuals and “edges” are contacts
  • Important decisions: Binary vs weighted? Undirected vs directed?

Static vs dynamic?

  • Basic network statistics include degree distribution (number of edges per

node) and clustering coefficient (How many of my friends are friends with each other?)

  • Powerful tools of discrete mathematics can be applied.

Models for population structure

Individual-based model (IBM)

  • r microsimulation model
  • The most flexible framework.
  • Every individual in the model carries its own attributes (age, sex,

location, contact behaviour, etc etc)

  • Can represent arbitrarily complex systems ( = realistic?) and ask detailed

questions, but difficult to estimate parameters and to analyze model output; also difficult for others to replicate the model.

  • STDSIM is a famous example, used to study transmission and control of

sexually transmitted diseases including HIV in East Africa.

Rabies in space

Rabies is an acute viral disease of mammals, that causes cerebral dysfunction, anxiety, confusion, agitation, progressing to delirium, abnormal behavior, hallucinations, and insomnia. Transmitted by infected saliva, most commonly through biting. Latent period = 3 – 12 weeks (in raccoons) Infectious period = 1 week (ends in death) Pre-exposure vaccination offers effective protection. Post-exposure vaccination possible during latent period.

  • Until mid 1970s, raccoon rabies was restricted to FL and GA.
  • Then rabid raccoons were translocated to the WV-VA border,

and a major epidemic began in the NE states.

Major Terrestrial Reservoirs of Rabies in the United States

Raccoon Raccoon

slide-3
SLIDE 3

3

Spatial invasion of Rabies across the Northeastern U.S. 23 years (1977-1999)

Rabies in wildlife in US

Smith et al (2002) PNAS 99: 3668-3672 Russell et al (2004) Proc Roy Soc B 271: 21-25.

Models of the spatial spread of rabies

Simple patch model (+ small long-range transmission term) was able to fit data well. Macroparasitic diseases: worm burdens in individuals are overdispersed, and well- described by a negative binomial distribution. STDs and vector-borne diseases: Woolhouse et al (PNAS, 1998) analyzed contact rate data and proposed a general 20/80 rule: 20% of hosts are responsible for 80% of transmission But how to approach other directly-transmitted diseases, for which contacts are hard to define?

Individual heterogeneity

Percentage of host population Transmission potential 20 40 60 80 100 20 40 60 80 100

Percentage of host population

% Transmission potential (R0)

Every host is equal 20-20 Heterogeneity in the population 20-80

The vital few and insignificant many – the 20/80 rule:

20% of hosts account for 80%

  • f pathogen transmission

Slide borrowed from Sarah Perkins R0

Individual reproductive number, ν Expected number of cases caused by a particular infectious individual in a susceptible population.

ν ν

Basic reproductive number, R0 Expected number of cases caused by a typical infectious individual in a susceptible population. ν varies continuously among individuals, with population mean R0.

A model for individual heterogeneity

Individual reproductive number, ν Expected number of cases caused by a particular infectious individual in a susceptible population. Z = actual number of cases caused by a particular infectious individual. Z = 2 Z = 0 Z = 1 Z = 3 … The offspring distribution defines Pr (Z=j) for all j.

Z ~ Poisson(ν)

Stochasticity in transmission

slide-4
SLIDE 4

4

Branching process: a stochastic model for disease invasion into a large population. For any offspring distribution, it tells you:

  • Pr(extinction)
  • Expected time of extinction and number of cases
  • Growth rate of major outbreak

ν Contact tracing for SARS Observed offspring distribution

Number of secondary cases, Z

Estimated distribution of individual reproductive number, ν

Singapore SARS outbreak, 2003

What about other emerging diseases?

Hantavirus* Pneumonic plague Monkeypox SARS, Beijing Smallpox Variola minor

greater heterogeneity

Basic reproductive number, R0 Probability of extinction

Dynamic effects: stochastic extinction of disease

k = 0.1 k = 1 k→∞

Read more about individual heterogeneity and superspreading in Lloyd-Smith et al (2005) Nature 438: 355-359.

slide-5
SLIDE 5

5

Transmission: mechanisms matter

Transmission dynamics are the core of epidemic models

  • Take time to think about the mechanisms underlying

transmission, and to find the best tradeoff between model simplicity and biological realism. e.g. Between-group transmission in metapopulations Frequency-dependent transmission vs pair-formation models Generalized R0 for a multi-group population Rij = E(# cases caused in group j|infected in group i)

The R-matrix or next-generation matrix

Usual approach considers group membership as static. Di = expected infectious period, spent entirely in group i βij = transmission rate from group i to group j The expected number of cases in group j caused by an individual infected in group i is then: Rij = Diβij But what if the host moves and transmission is strictly local? Dij = expected time spent in group j by individual infected in group i, while still infectious βj = transmission rate within group j Now Rij = Dijβj

Analytic approach to R

If movement rules are Markovian, so pij = Pr(move from group i to group j): mj = Pr(recover or die while in group j) The process can be described by an absorbing Markov chain, with overall transition matrix: R-matrix:

Rij = Dijβj

1

P) (I D

− =

The expected residence times Dij are then given by the fundamental matrix:

⎥ ⎦ ⎤ ⎢ ⎣ ⎡

×

1 m P

n n

x x x x x x x

Transmission in a metapopulation

Simulate:

  • range of multi-group population structures
  • acute and chronic diseases

1 group of 1000 25 groups of 40 100 groups of 10

Acute disease

Acute and chronic diseases with same R0 behave very differently when invading a metapopulation.

Chronic disease 10

−3

10

−2

10

−1

10 10

1

0.2 0.4 0.6 0.8 1 movement rate/recovery rate Total proportion infected R0= 2 R0= 5 R0= 10 R0= 20

R0 does not predict invasion for this system!

slide-6
SLIDE 6

6

Units of analysis: R0 versus R*

R*

R

Units of analysis: R0 versus R*

  • R* = the expected number of groups infected by the first

infected group (a group-level R0). (Ball et al. 1997 Annals of Appl. Prob.)

  • Analytical expressions for R0 or R* are hard to find for

systems with mechanistic movement, finite group sizes, and finite numbers of groups.

  • Use “empirical” values: mean values from simulations

where we track who infects whom.

ˆ R

*

ˆ R

Predictors of disease invasion

β 2 4 6 8 10 12 mean proportion infected 0.0 0.2 0.4 0.6 0.8 1.0 0.1 0.5 1.0 4.3 9.0 15

*

ˆ R

β 2 4 6 8 10 12 mean proportion infected 0.0 0.2 0.4 0.6 0.8 1.0 0.1 0.5 1.0 4.3 9.0 15

ˆ R

R* is a much better predictor of disease invasion in a structured population than R0

Cross et al. 2005 Eco. Letters

Approaching R* μ/γ = expected number of movements between groups by an individual during its infectious period pI = expected proportion of initial group infected following the initial outbreak. If R0 is large, then pI ~1. pInμ/γ = expected number of infectious individuals that will disperse from the initial group R0 ≈ β /γ So: for a pandemic, we require R0 >1 and pI nμ/γ >1. crudely, R* will increase with pI n μ/γ and with β /γ. A proper mathematical treatment of this problem is needed! Summary on mechanisms in multi-group models

  • Need to consider timescales of relevant processes:

mixing, recovery, transmission, (susc. replenishment)

  • In some limits, simpler models do OK.
  • In general, and especially when different processes
  • ccur on similar timescales,

mechanistic models are needed to capture dynamics.

  • Appropriate “units” aid prediction.

Read more about disease invasion in structured populations in Cross et al (2005) Ecol Lett 8: 587-595 Cross et al (2007) JRS Interface 4:315-324..

A mechanistic model for STD transmission S I

Incidence rate = f (S,I) STDs are often modelled using frequency-dependent incidence: cFD = rate of acquiring new partners pFD = prob. of transmission in S-I partnership S/N = prob. that partner is susceptible I = density of infectives I N S p c I S f ⎟ ⎠ ⎞ ⎜ ⎝ ⎛ =

FD FD

) , (

Read more about pair-formation models for STDs in Lloyd-Smith et al (2004) Proc Roy Soc B 271: 625-634

slide-7
SLIDE 7

7

Pair dynamics

X = single individual P = pair k = pairing rate (per capita) l = pair dissolution rate

Singles Pairs

k l

P X

Pair dynamics

Singles Pairs

kmSI kmII kmSS kmIS l l l l

PSS PSI PII XS XI

Xy = single individual of type y (where y = S or I) Pyz = pair of types y and z (where y,z = S or I) k = pairing rate (per capita) l = pair dissolution rate myz = “mixing matrix”

Singles Pairs

kSmSI kImII kSmSS kImIS lSI lSI lII lSS

PSS PSI PII XS XI

Pair dynamics

Transmission occurs only in S-I pairs (PSI), at rate βpair Xy = single individual of type y (where y = S or I) Pyz = pair of types y and z (where y,z = S or I) ky = pairing rate (per capita) lyz = pair dissolution rate myz = “mixing matrix”

Pair-formation epidemic

Consider populations where pairing dynamics are much faster than disease dynamics. Timescale approximation: pairing dynamics are at quasi-steady-state relative to disease dynamics

(c.f. Heesterbeek & Metz (1993) J. Math. Biol. 31: 529-539.) PSS PSI PII XS XI

βpairPSI σ σ σ μ μ μ μ μ μ μ μ μ λ

Fast pairing timescale Singles Pairs

kSmSI kImII kSmSS kImIS lSI lSI lII lSS

PSS PSI PII XS XI βpair P*SI

Timescale approximation

Challenge: find P*

SI in terms of S, I, and pairing

  • parameters. Then incidence rate = βpair P*

SI

Timescale approximation for pairing

Slow epidemic timescale

S= X

S + 2

P

SS +

P

SI

I = X

I + 2

P

II +

P

SI

Entire population

mS

S I

mI sI l

⎪ ⎪ ⎪ ⎪ ⎪ ⎪ ⎩ ⎪ ⎪ ⎪ ⎪ ⎪ ⎪ ⎨ ⎧ − = − + = − = + + − = + + − =

II II I II I 2 1 SI SI I IS I 2 1 S SI S 2 1 SS SS S SS S 2 1 SI SI II II I I SI SI SS SS S S S

2 2 P l X m k dt dP P l X m k X m k dt dP P l X m k dt dP P l P l X k dt dX P l P l X k dt dX

II SI SS I

Fast pairing dynamics

( )

⎪ ⎪ ⎩ ⎪ ⎪ ⎨ ⎧ + − = − + − = I P dt dI S I P dt dS μ σ β μ σ β λ

* SI pair * SI pair

Slow disease dynamics

slide-8
SLIDE 8

8

Substitute: Set dPyz/dt’s = 0, solve for P*

SI

⎪ ⎪ ⎭ ⎪ ⎪ ⎬ ⎫ + = = + = =

I I S S I I II SI I I S S S S IS SS

X k X k X k m m X k X k X k m m Assume random mixing in pair formation ⎭ ⎬ ⎫ + + = + + =

SI II I SI SS S

2 2 P P X I P P X S Total all susceptibles and infectives, single and paired

Finding P*SI from fast equations

Disease status has no effect on pairing behaviour. k = pairing rate for all individuals l = break-up rate for all partnerships

Simplest case: uniform behaviour N SI l k k P ⎟ ⎠ ⎞ ⎜ ⎝ ⎛ + =

pair * SI pair

β β

Incidence rate =

I N S p c ⎟ ⎠ ⎞ ⎜ ⎝ ⎛

FD FD

Recall the FD incidence: pFD = probability of transmission in S-I partnership = 1−exp(−βpair ×1/l) cFD = rate of acquiring partners =

l k kl

k l

+ = + 1

1

1

Pair-based transmission and frequency dependence

) (since

pair pair

l l << ≈ β β

N SI l k k N SI p c ⎟ ⎠ ⎞ ⎜ ⎝ ⎛ + ≈

pair FD FD

β

Use mechanistic derivation of FD to assess this assumption. Frequency dependence can represent pair-based transmission but timescale approximation is required.

Pair-based transmission and frequency dependence

We know STD dynamics are driven by pair-based transmission. FD models implicitly make timescale approximation. Conversely:

Application to STD models

Transient, highly-transmissible STDs

  • High chance of infection per

exposure

  • Most individuals recover

within a month

  • e.g. gonorrhoea, chlamydia

Many bacterial STDs Chronic, less-transmissible STDs

  • Low chance of infection per

exposure

  • No recovery!
  • e.g. HIV, HSV-2

Many viral STDs

When does FD adequately represent pair-based transmission? Compare simulations: frequency-dependent incidence vs. full simulation of pair dynamics and disease for different timescales of:

  • disease – bacterial and viral STDs
  • pairing dynamics – define average pair lifetime, D

k l 1 1 D = =

slide-9
SLIDE 9

9

Timescale approximation breaks down badly for D ~ 3 days Transient, highly-transmissible STD Chronic, less-transmissible STD Frequency dependence is a good depiction of pair-based transmission only when mixing occurs fast compared to disease timescales. Four cases: 1. No effect on behaviour 2. Disease alters pair-formation rate, kS ≠ kI 3. Disease alters break-up rate, lSS ≠ lSI ≠ lII 4. Disease alters both ky and lyz (y, z = S or I)

Singles Pairs

kSmSI kImII kSmSS kImIS lSI lSI lII lSS

PSS PSI PII XS XI

Modelling disease-induced behaviour changes

For all four cases, the incidence rate takes a generalized frequency-dependent form:

Modelling disease-induced behaviour changes

where φκ(s,i) is a function of s=S/N, i=I/N and the pairing parameters.

N SI i s ) , (

pair κ

φ β

kS ∫ kI lSS ∫ lSI ∫ lII 4 kS=kI=k lSS ∫ lSI ∫ lII 3 kS ∫ kI lSS=lSI=lII=l 2 kS=kI=k lSS=lSI=lII=l 1 φk(s,i) Rates, k Case

( ) ( )

⎟ ⎠ ⎞ ⎜ ⎝ ⎛ − + + + si a i s i s

2 I S 2 I S I S 2 1 I S

4 π π π π π π π π

si a

2 2 1 2 1

4 1 π π − + i s

I S I S

π π π π +

l k k +

where s=S/N, i=I/N, πy=ky/(ky + lSI) and If kS=kI, then πS= πI ªπ.

⎟ ⎟ ⎠ ⎞ ⎜ ⎜ ⎝ ⎛ − + ⎟ ⎟ ⎠ ⎞ ⎜ ⎜ ⎝ ⎛ − + ⎟ ⎟ ⎠ ⎞ ⎜ ⎜ ⎝ ⎛ − =

II SS 2 SI II SI S SI SS SI I SI

1 1 1 l l l l l k l l l k l a

Calculation of R0 ( )

cases. four all in ) , ( lim 1 ) , ( lim lim

SI I I pair pair pair

⎟ ⎟ ⎠ ⎞ ⎜ ⎜ ⎝ ⎛ + + = + = ⎟ ⎟ ⎠ ⎞ ⎜ ⎜ ⎝ ⎛ + × = =

→ → →

l k k i s N S i s R

N S N S N S

μ σ β φ μ σ β μ σ φ β

κ κ

(transmission rate per I individual × duration of infectiousness)

  • No dependence on kS
  • No dependence on lSS or lII
  • Identical to standard FD result,

if cFD = contact rate of infected individuals

μ σ + =

FD FD

p c R

Calculation of stability threshold

Consider stability threshold of the no-infection equilibrium, when population is wholly susceptible: R0 > 1 ↔ no-infection equilibrium is unstable to perturbations in I R0 > 1 ↔ Yields the same result as R0 calculation in all four cases – though note that just because a quantity is an epidemic threshold parameter does not mean that it equals R0!! e.g. (R0)k for any k>0 also has an epidemic threshold at 1.

) , ( where , I S f dt dI I f

I N S I

= > ⎥ ⎦ ⎤ ⎢ ⎣ ⎡ ∂ ∂