
SLIDE 1
1
Phylogenetics 3: Methods to reconstruct phylogenies
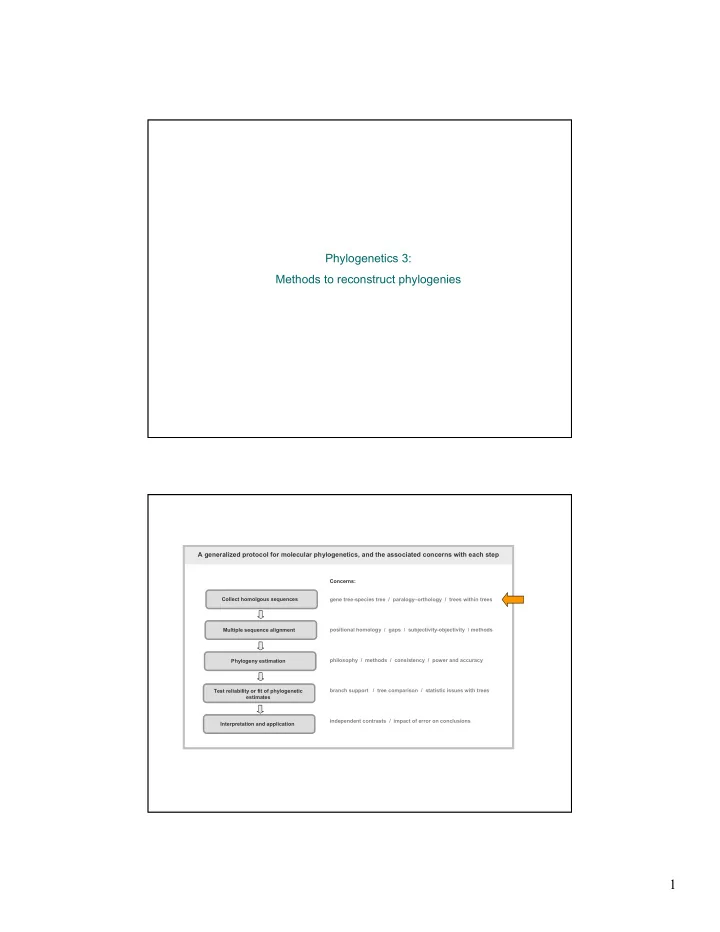
A generalized protocol for molecular phylogenetics, and the associated concerns with each step
Collect homolgous sequences Multiple sequence alignment Phylogeny estimation Test reliability or fit of phylogenetic estimates Interpretation and application Concerns: gene tree-species tree / paralogy–orthology / trees within trees positional homology / gaps / subjectivity-objectivity / methods philosophy / methods / consistency / power and accuracy branch support / tree comparison / statistic issues with trees independent contrasts / impact of error on conclusions