
1
1
Debugging and debuggers
You have probably already had the experience of making
a mistake in a program
Speaking roughly, “debugging” is the process:
- After you know that your code is wrong
- But before you know how it is wrong
Some kinds of debugging that don’t need much tool
support:
- Code review
- Rubber duck debugging
- Printf debugging
2
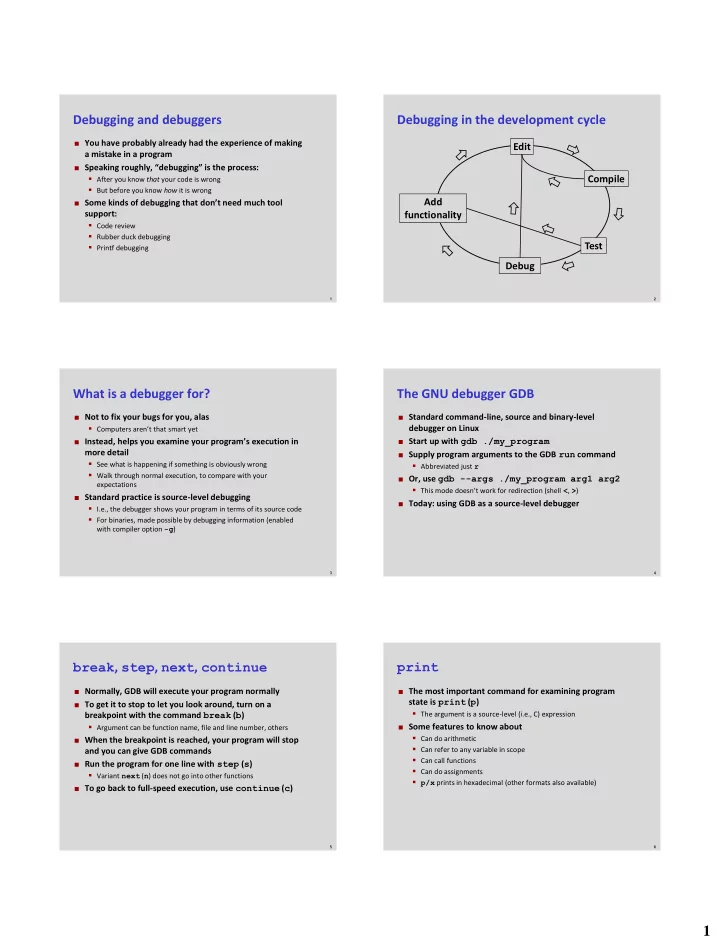
Debugging in the development cycle
Add functionality Edit Compile Test Debug
3
What is a debugger for?
Not to fix your bugs for you, alas
- Computers aren’t that smart yet
Instead, helps you examine your program’s execution in
more detail
- See what is happening if something is obviously wrong
- Walk through normal execution, to compare with your
expectations
Standard practice is source-level debugging
- I.e., the debugger shows your program in terms of its source code
- For binaries, made possible by debugging information (enabled
with compiler option -g)
4
The GNU debugger GDB
Standard command-line, source and binary-level
debugger on Linux
Start up with gdb ./my_program Supply program arguments to the GDB run command
- Abbreviated just r
Or, use gdb --args ./my_program arg1 arg2
- This mode doesn’t work for redirection (shell <, >)
Today: using GDB as a source-level debugger
5
break, step, next, continue
Normally, GDB will execute your program normally To get it to stop to let you look around, turn on a
breakpoint with the command break (b)
- Argument can be function name, file and line number, others
When the breakpoint is reached, your program will stop
and you can give GDB commands
Run the program for one line with step (s)
- Variant next (n) does not go into other functions
To go back to full-speed execution, use continue (c)
6
The most important command for examining program
state is print (p)
- The argument is a source-level (i.e., C) expression
Some features to know about
- Can do arithmetic
- Can refer to any variable in scope
- Can call functions
- Can do assignments
- p/x prints in hexadecimal (other formats also available)