
SLIDE 1
1
CLINICAL PHARMACOKINETICS
Juan J.L. Lertora, M.D., Ph.D.
Director
Clinical Pharmacology Program
Office of Clinical Research Training and Medical Education National Institutes of Health Clinical Center
USES OF PHARMACOKINETICS
- Basis for rational dose selection in therapeutics
- Development and evaluation of new drugs
- Basic studies of drug distribution (PET Scan)
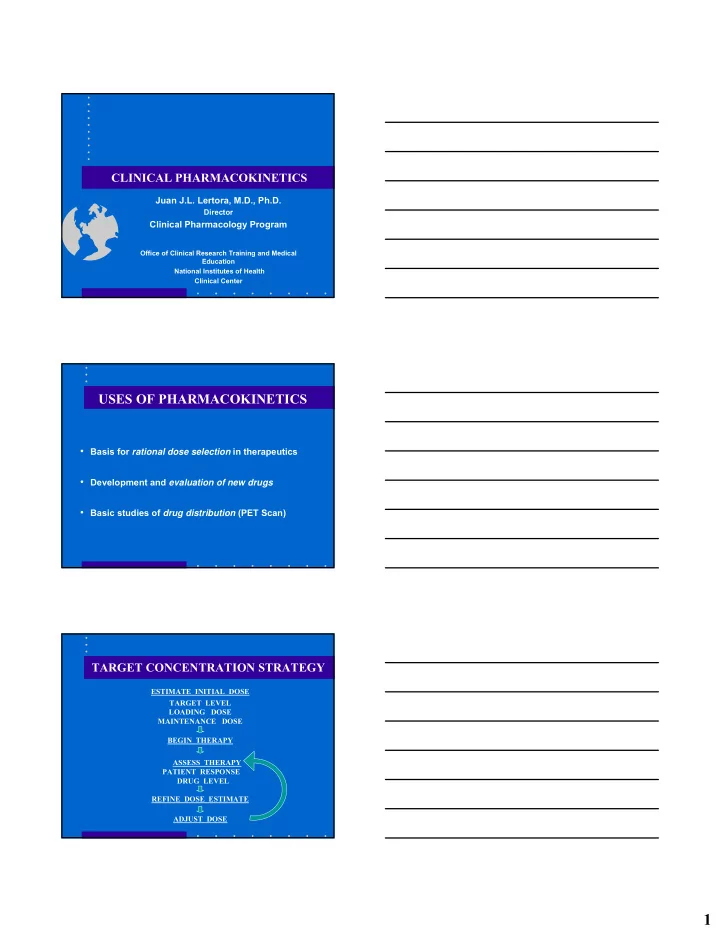
ESTIMATE INITIAL DOSE TARGET LEVEL LOADING DOSE MAINTENANCE DOSE
TARGET CONCENTRATION STRATEGY
BEGIN THERAPY ASSESS THERAPY PATIENT RESPONSE DRUG LEVEL REFINE DOSE ESTIMATE ADJUST DOSE