1 Definition Clinical diagnosis is by either. Disorder - - PDF document

1
SMART_READER_LITE
LIVE PREVIEW

1 Definition Clinical diagnosis is by either. Disorder - - PDF document

Objectives Review osteoporosis risk assessment: A Bone to Pick: Osteoporosis Risk Guidelines Assessment Controversies Carolyn J. Crandall, MD, MS Professor of Medicine David Geffen School of Medicine at UCLA The Situation 1 in


slide-1
SLIDE 1

1

A Bone to Pick: Osteoporosis Risk Assessment

Carolyn J. Crandall, MD, MS Professor of Medicine David Geffen School of Medicine at UCLA

Objectives

  • Review osteoporosis risk assessment:

 Guidelines  Controversies

The Situation

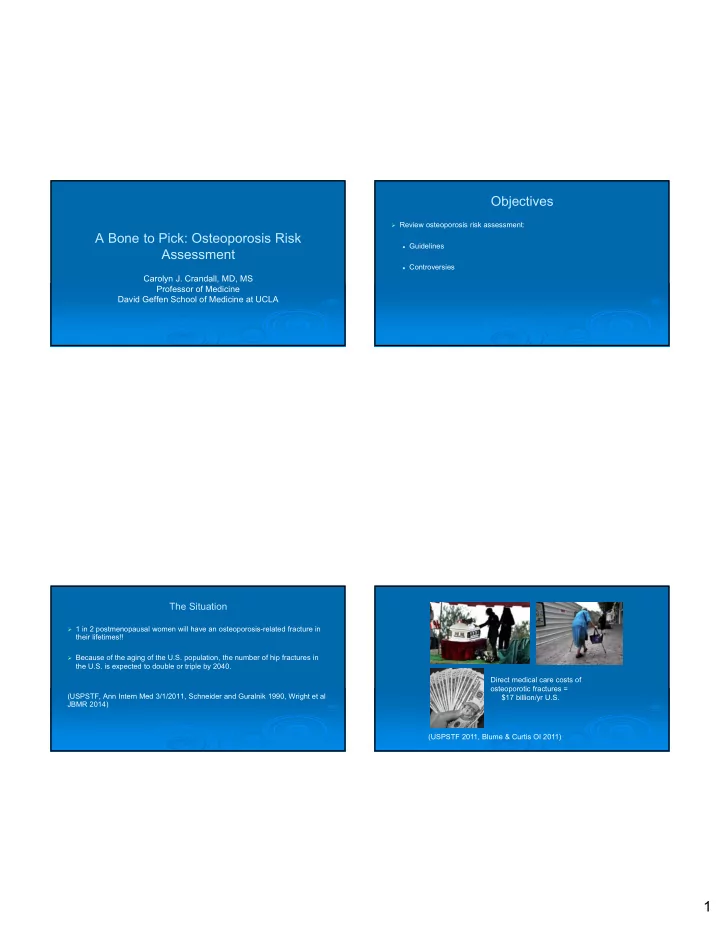
  • 1 in 2 postmenopausal women will have an osteoporosis-related fracture in

their lifetimes!!

  • Because of the aging of the U.S. population, the number of hip fractures in

the U.S. is expected to double or triple by 2040. (USPSTF, Ann Intern Med 3/1/2011, Schneider and Guralnik 1990, Wright et al JBMR 2014) Direct medical care costs of

  • steoporotic fractures =

$17 billion/yr U.S. (USPSTF 2011, Blume & Curtis OI 2011)

slide-2
SLIDE 2

2

Definition

  • Disorder characterized by low bone mass and microarchitectural

deterioration of bone tissue, leading to enhanced bone fragility and a consequent increase in fracture risk. (Consensus development conference: diagnosis, prophylaxis and treatment of

  • steoporosis, Am J Med 1993 & WHO Technical Report Series 843, Geneva 1994,

Surgeon General’s Report on Bone Health and Osteoporosis 2004)

Clinical diagnosis is by either….

  • Adulthood hip or vertebral fracture in the absence of major trauma (such as

motor vehicle accident of multiple story fall)---regardless of BMD value!!

  • r
  • BMD T-score ≤ -2.5 at lumbar spine or hip by dual-energy x-ray

absorptiometry (DXA) (National Osteoporosis Foundation Clinician’s Guide to Prevention and Treatment of Osteoporosis 2014 www.nof.org, Amer. Assoc. Clin. Endocrinologists 2010)

World Health Organization Diagnostic class.

(National Osteoporosis Foundation Clinician’s Guide to Prevention and Treatment of Osteoporosis 2014 www.nof.org & ISCD.org)(ref 20-29 y/o ♀ NHANES Looker et al 1998)

Classification BMD T-score Normal Within 1 SD of a young adult reference population T-score at -1.0 and above Low Bone Mass (Osteopenia) Between 1.0 and 2.5 SD below that of a young-adult reference population T-score between

  • 1.0 and -2.5

Osteoporosis 2.5 SD or more below that of a young-adult reference population T-score at or below -2.5 Severe or Established Osteoporosis 2.5 SD or more below that of a young- adult reference population T-score at or below -2.5 with one or more fractures

Which test?

  • Current diagnostic and treatment criteria rely on dual-

energy x-ray absorptiometry (DXA) measurements of lumbar spine and hip ONLY.

  • T-scores from other technologies cannot be used

according to the WHO diagnostic classification because they are not equivalent to T-scores derived from DXA. (USPSTF Ann Intern Med 3/1/2011, National Osteoporosis Foundation Clinician’s Guide to Prevention and Treatment

  • f Osteoporosis 2014 www.nof.org, International Society

for Clinical Densiometry 2015)

slide-3
SLIDE 3

3

Whom to screen

Which women to screen

  • Women 65 years or older (USPSTF 2011, NOF 2014)
  • Postmenopausal women aged 50-64:

 fracture during adulthood, or  condition (e.g. rheumatoid arthritis) or medication associated with low

bone mass or bone loss (NOF 2014)

 Women <65 y/o whose 10-year risk of osteoporotic fracture is ≥ that of a

65-year-old white woman who has no additional risk factors (i.e. ≥ 9.3%) (USPSTF) (USPSTF Ann Intern Med 3/1/2011, National Osteoporosis Foundation Clinician’s Guide to Prevention and Treatment of Osteoporosis 2014 www.nof.org)  http://www.sheffield.ac.uk/FRAX/

U.S. FRAX in 2016 (version 3.10)

Race- specific Outputs: 10-year prob. of hip fracture & 10-year

  • prob. of major osteoporotic fracture (clinical

spine, forearm, hip or shoulder fracture) BMD info

  • ptional

FRAX practical considerations

  • Not validated for spine bone mass

 If normal hip bone mass with low spine bone mass, FRAX underestimates

fracture risk

  • Not validated for:

 Patients treated with osteoporosis pharmacotherapy past 1-2 years

  • Underestimates fracture risk in patients with:

 Recent or multiple fractures  Those at increased risk for falling

(National Osteoporosis Foundation Clinician’s Guide to Prevention and Treatment of Osteoporosis 2014 www.nof.org)

slide-4
SLIDE 4

4

Controversy 1: Screening young postmenopausal women

  • United States Preventive Services Task Force (USPSTF)

 Women 65 years or older  Women <65 y/o whose 10-year predicted risk of major osteoporotic

fracture is ≥ 9.3 % (65 year-old white woman no other osteoporosis risk factors) (USPSTF, Ann Intern Med 3/1/2011) 

Prior to advent of FRAX

  • Osteoporosis Self-Assessment Tool (OST):

 weight, age (Cadarette 2004, Geusens 2002, Gourlay 2005, Lydick 1998)

  • Simple Calculated Osteoporosis Risk Estimation Tool (SCORE):

 weight  age  race  rheumatoid arthritis  non-traumatic hip, wrist, or rib fracture after age 45 years  prior estrogen therapy (Lydick 1998)

(Crandall, et al J Clin Endocrinol Metab. 2014 Dec;99(12):4514-22. doi: 10.1210/jc.2014-2332. PMID: 25322268)

Objective

  • To compare, among postmenopausal U.S. women aged 50-64 years, the

ability of the current USPSTF FRAX-based screening strategy with that of SCORE and OST to discriminate between women who did and did not experience incident major osteoporotic fractures over 10 years of f/u.

  • No published studies had done this.
slide-5
SLIDE 5

5

Sensitivity, specificity, and AUC values for identifying major

  • steoporotic fracture (10 years of follow-up), stratified by age

(Crandall et al, J Clin Endocrinol Metab. 2014 99(12):4514-22)

Varying cutpoints to obtain sensitivity of ≥ 80%

SCORE > 2 81.0 (80.0-82.1) 22.0 (21.6-22.3) 8.7 (8.4-8.9) 0.52 (0.51-0.52) > 1 85.8 (84.9-86.8) 17.1 (16.8-17.4) 8.6 (8.4-8.9) 0.51 (0.51-0.52) > -1 91.7 (91.0-92.5) 10.2 (10.0-10.4) 8.5 (8.3-8.8) 0.51 (0.51-0.51) > -3 95.4 (94.8-95.9) 5.9 (5.7-6.1) 8.5 (8.3-8.7) 0.51 (0.50-0.51) > -9 99.0 (98.8-99.3) 1.2 (1.1-1.3) 8.4 (8.2-8.6) 0.50 (0.50-0.50) FRAX Sens (95% CI) Spec (95% CI) PPV (95% CI) AUC (95% CI) ≥ 4.81 80.1 (79.0-81.2) 28.7(28.3-29.1) 9.3 (9.0-9.6) 0.54 (0.54-0.55) ≥ 4.33 85.2 (84.2-86.1) 22.8 (22.4-23.1) 9.2 (8.9-9.4) 0.54 (0.53-0.54) ≥ 3.75 90.1 (89.3-90.9) 16.1 (15.8-16.4) 8.9 (8.7-9.2) 0.53 (0.53-0.54) ≥ 2.98 95.0 (94.4-95.6) 9.1 (8.9-9.3) 8.7 (8.5-8.9) 0.52 (0.52-0.52) ≥ 1.79 99.0 (98.8-99.3) 1.8 (1.7-1.9) 8.4 (8.2-8.7) 0.50 (0.50-0.51) (Crandall, et al, J Clin Endocrinol Metab. 2014 99(12):4514-22)

Varying cut-points to obtain sensitivity ≥ 80%

OST Sens (95% CI) Spec (95% CI) PPV (95% CI) AUC (95% CI) < 6 80.6 (79.5‐81.7) 18.9 (18.5‐19.2) 8.3 (8.1‐8.6) 0.50 (0.50‐0.51) < 7 86.5 (85.5‐87.4) 13.5 (13.2‐13.7) 8.4 (8.1‐8.6) 0.50 (0.50‐0.51) < 8 90.3 (89.5‐91.1) 9.6 (9.4‐9.8) 8.4 (8.1‐8.6) 0.50 (0.50‐0.50) < 10 95.1 (94.5‐95.7) 4.9 (4.7‐5.1) 8.4 (8.1‐8.6) 0.50 (0.50‐0.50) < 15 99.1 (98.8‐99.3) 1.0 (0.9‐1.0) 8.4 (8.2‐8.6) 0.50 (0.50‐0.50) (Crandall, et al, J Clin Endocrinol Metab. 2014 Dec;99(12):4514-22. PMID: 25322268)

Summary

  • Among women aged 50-64:

 The USPSTF strategy only identified about one-quarter of women who

went on to experience incident fracture during 10-year follow-up.

 The low sensitivity was especially apparent for the youngest women (ages

50-54 sensitivity 4.7%, specificity 97%).

 None of the 3 strategies performed better than chance alone in

discriminating between women who did and did not have a subsequent fracture. (Crandall et al JCEM 2014)

slide-6
SLIDE 6

6

Same situation for detecting T-score ≤ -2.5

Conclusions: The FRAX threshold recommended to identify screening candidates did not identify the majority of women who subsequently experienced wrist fracture. (J Clin Endocrinol Metab 100: 4315–4324, 2015)

Conclusion

  • Our findings suggest that fracture risk prediction in young postmenopausal

women requires assessment of risk factors not included in currently available strategies. “fracture risk assessment tool” NOT review [pt] Female, English language 9/25/2017 117 citations U.S., screening or risk assessment, not 2 causes 6 citations 10-years follow-up observed (incident) fractures 2 citations

  • 1. Jiang et al Obstet

Gynecol 2013

  • 2. FitzGerald J Clin

Endocrinol Metab 2014

  • 3. Bansal Osteoporos Int

2015

  • 4. Crandall, et al JBMR

2014

  • 5. Crandall, et al, J Clin

Endocrinol Metab. 2014

  • 6. Crandall, et al, JBMR

2015

slide-7
SLIDE 7

7

Height loss

  • Vertebral fractures detected incidentally by x-ray confer

dx of osteoporosis. So….

  • √ vertebral imaging (x-ray or on DXA) if any of following:

 T-score

  • ≤ -1.5 in ♀ ≥ 65-69 y/o, ♂ 70-79 y/o
  • ≤ -1.0 in ♀ ≥ 70 y/o ♂ ≥ 80 y/o

 Height loss ≥ 1.5” vs. peak, 0.8” in clinic over time - √

yearly!

 Low-trauma adult fx, recent/chronic prednisone use

(National Osteoporosis Foundation Clinician’s Guide to Prevention and Treatment of Osteoporosis 2014) Whom to screen Whom to treat Monitoring

Monitoring: Measurement error

  • Changes in BMD of < 3-6% at hip and 2-4% at spine from test to test may be

due to the precision error of the test itself! (National Osteoporosis Foundation Clinician’s Guide to Prevention and Treatment of Osteoporosis www.nof.org 2014)

Monitoring: Serial testing USPSTF

  • Evidence is lacking about optimal intervals.
  • Because of limitations in the precision of testing:

 minimum of 2 years to reliably measure a change in BMD  longer intervals may be necessary to improve fracture prediction.

(Ann Intern Med 3/1/2011)

slide-8
SLIDE 8

8

Monitoring: Untreated older women

Study of Osteoporotic Fractures postmenopausal women ≥65 y/o without prior fracture If baseline T-score is…. then the time period required for 10% of women to progress to

  • steoporosis BMD (before having a

fracture) was:

  • 1.01 to -1.49

17 years

  • 1.50 to -1.99

5 years

  • 2.00 to -2.49

1 year (Gourlay et al NEJM 2012)

Monitoring: Untreated younger postmenopausal women

  • Women’s Health Initiative study

If no osteoporosis at baseline: then the time period required for 1%

  • f women to experience hip or

clinical vertebral fracture was: 50-54 years-old 12 years 55-59 years-old 11 years 60-64 years-old 7 years (vs. osteoporosis at baseline all ages) (3 years) Women 50-64 y/o without osteoporosis on 1st BMD test are unlikely to benefit from frequent rescreening before age 65. (Gourlay, Overman, Fine, Ensrud, Crandall et al Menopause 2014) Whom to screen Whom to treat Monitoring

Whom to treat: NOF 2014

  • Postmenopausal women age ≥50 if:

 Hip or vertebral (clinical or asymptomatic) fracture, or  BMD T-score ≤ -2.5 femoral neck, total hip, or lumbar spine by DXA, or  BMD T-score between -1.0 and -2.5 (femoral neck, total hip, or spine) by

DXA if:

  • 10-yr probability of hip fracture ≥3% or
  • 10-yr probability of major osteoporosis-related fracture ≥20% based on

U.S. WHO FRAX. (National Osteoporosis Foundation Clinician’s Guide to Prevention and Treatment of Osteoporosis 2014 www.nof.org)

slide-9
SLIDE 9

9

Controversy 2: The Wrist Fracture

  • Should wrist fractures be an indication for pharmacotherapy too?
  • Most common fracture type in

perimenopausal women.

  • No longitudinal U.S. studies had examined fracture

types following wrist fracture in postmenopausal women.

  • First step.

Crandall et al, Journal of Bone and Mineral Research, Vol. 30, No. 11, November 2015, pp 2086–2095

Objective

  • To determine among postmenopausal women the associations between wrist

fracture and subsequent fracture incidence, according to anatomic site and age. (Crandall et al JCMR 2015)

Associations between Incident Wrist Fracture and Subsequent Fracture

Wrist Fracture No Yes Total N Event

  • Adj. HR (95% CI)

Any non-wrist 136,017 28,790 1 (ref) 1.37 (1.29-1.46) Spine Fracture 136,017 4,544 1 (ref) 1.46 (1.29-1.65) Humerus 136,017 3,676 1 (ref) 1.67 (1.46-1.92) Upper extr. (non-wrist) 136,017 6,184 1 (ref) 1.80 (1.62-2.01) Lower extr. (non-hip) 136,017 12,718 1 (ref) 1.30 (1.19-1.43) Hip fracture 136,017 3,186 1 (ref) 1.48 (1.28-1.71) Mean f/u 11 yrs, adj. falls +..(Crandall et al, JBMR, 2015, 30 (11): 2086–2095)

slide-10
SLIDE 10

10

Time to any non-wrist fracture in the presence and absence

  • f initial wrist fracture during the WHI follow-up

(unadjusted cumulative incidence with vs. without prior wrist fracture) (Crandall et al, JBMR, 2015, 30 (11): 2086–2095) Time to any non-wrist fracture in the presence and absence

  • f initial wrist fracture during the WHI follow-up

(unadjusted cumulative incidence with vs. without prior wrist fracture) (Crandall et al, JBMR, 2015, 30 (11): 2086–2095) Guideline: treat women ≥ 50 y/o with 10-yr prob. of major

  • steoporosis-

related fracture ≥20%

Summary

  • Nearly 1 in 5 women with initial wrist fracture went on to experience a

subsequent non-wrist fracture over 11 years of follow-up.

  • Our results suggest substantial missed opportunity for intervention in the

large number of women who present with wrist fractures to prevent subsequent fractures.

Case

  • 67 year-old healthy woman (no fracture) baseline screening DXA:

 femoral neck T-score of -1.7  lumbar spine T-score of -1.9.

  • The most appropriate next step is:

 1. No further evaluation  2. FRAX assessment  3. prescribe bisphosphonate  4. prescribe raloxifene

slide-11
SLIDE 11

11

Case

  • 67 year-old healthy woman (no fracture) baseline screening DXA:

 femoral neck T-score of -1.7  lumbar spine T-score of -1.9.

  • The most appropriate next step is:

 1. No further evaluation  2. FRAX assessment  3. prescribe bisphosphonate  4. prescribe raloxifene

Future

  • Garvan risk calculator

 Includes falls  No longitudinal large U.S. studies vs. FRAX

  • FRAX doesn’t work well with DM (numerous studies by Leslie et al)
  • FRAX may include falls in future

Ok, so what to do in clinic??

  • Women ≥ 65 y/o

 screen, rescreen based on initial T-score:  T-score -1.0 to -1.9: I wait 5 years  T-score -2.0 to -2.4: I wait 1-2 years

  • Women aged 50-64

 screen based on FRAX score? Definitely secondary causes!

  • Don’t ignore incidentally-detected vertebral fx
  • Treat women ≥ 50 y/o if : Hip or vertebral fracture or BMD T-score ≤ -2.5.
  • Treat BMD T-score between -1 and -2.5 selectively based on presence of
  • ther fracture risk factors.
  • Only 3 in 10 fractures in U.S.

are followed up with testing or treatment!

  • After hip fracture:

 Only 40% fully regain their

pre-fracture level of independence.

 Only 1 in 3 are treated

within 12 months of d/c (The State of Health Care Quality 2015 National Committee for Quality Assurance http://www.ncqa.org/, NOF 2014, Ota 1994; Magaziner et al 2003, Solomon et al JBMR 2014)

slide-12
SLIDE 12

12