SLIDE 1 1
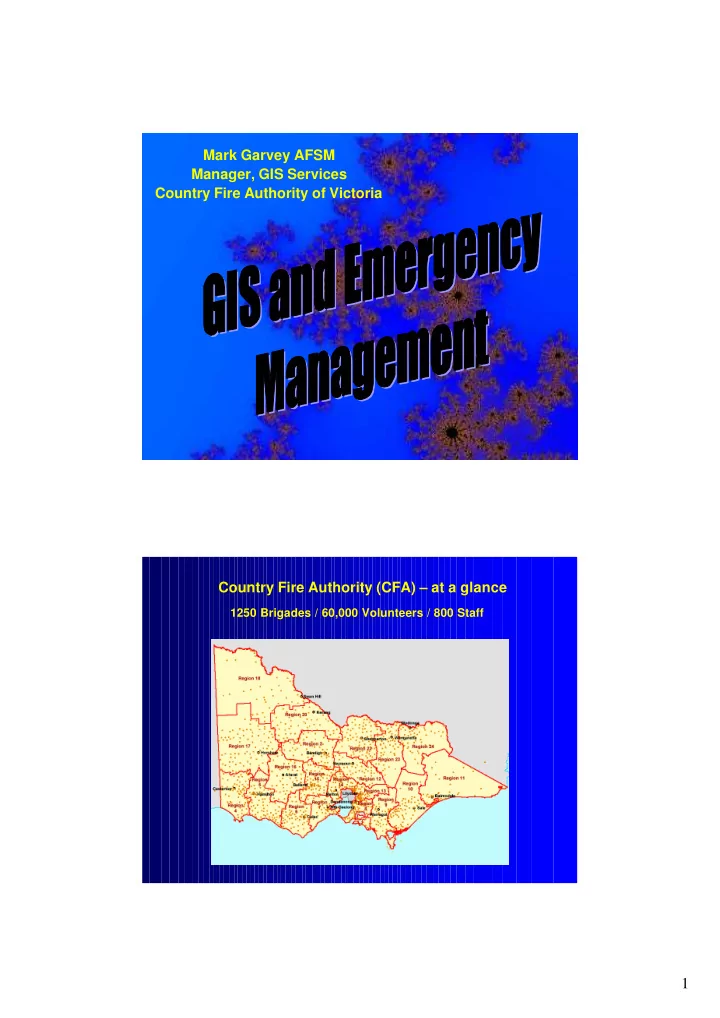
Mark Garvey AFSM Manager, GIS Services Country Fire Authority of Victoria Country Fire Authority (CFA) – at a glance
1250 Brigades / 60,000 Volunteers / 800 Staff
SLIDE 2
2
Incidents – 30,000+ per year Victoria prone to regular bushfires
SLIDE 3
3
CFA responds to structure fires, bushfires, hazmat incidents and road accidents Longford Refinery Fire 300 Km from Melbourne Melbourne’s growth - most is in CFA area Current population in CFA approx: 2.4M
SLIDE 4 4
Special Risks
Wharves, Nursing home etc.
Industrial Areas - Buffers
High Low
Transport Risks
Main haulage transportation routes Wildfire fuel loads Low fire fuel areas Weather data Slope/aspect
Wildfire Risks
High High Low Low
Structure Risk
High High Low Low
Residential, Commercial
Demographic Risks
High High Low Low
Population & Socio-economic factors
Spatial Information assists in assessing assists in assessing a variety of risk environments a variety of risk environments
Know your business - Fire statistics
SLIDE 5
5
Know your Customers – Demographic data Know your Workforce – HR databases
SLIDE 6
6 Know your Limitations - Road Network Models
Know your Future – Urban growth forecasts
SLIDE 7 7
Install fire detection Site education/ Industry training
Inspect Industries Relocate station New appliance required Adjust Staffing
Increased fire prevention
education programs.
Variety of decisions supported by a variety of GIS analyses
Achieving the GIS Vision
“Creating the Capacity” Develop easy to use interfaces to GIS Three examples built by CFA GIS Services
- Maps Online
- CFA Mapper
- Firebox Lite
SLIDE 8
8
Maps Online
3500 digital maps available to all CFA staff and volunteers over the intranet and internet Only requires Acrobat to view maps as they are all in .pdf format Maps Online Topographic Maps 1:25,000 1:50,000 1:100,000 General Maps e.g. Admin Boundaries
SLIDE 9 9
Making GIS mapping more accessible to novice users Installed in all Region HQs
CFA Mapper
100 + layers of GIS data available
- Imagery
- Air photos
- Admin bdys
- Topographic
- Transport
- Demographic
- Operational
CFA Mapper
SLIDE 10 10
Visualization of Bushfire Data Brings together GPS derived fire perimeter data into GIS Standard products created
FireBox Lite Achieving the GIS Vision
“Expert Spatial Analysis and Services” Two examples
- Infrastructure planning – Road Network
Modelling
- Targeted education campaign – “Bushfire
Blitz”
SLIDE 11
11
Dispatch boundaries calculated Dispatch boundaries calculated
Breathing Apparatus - Numbers on scene by time Breathing Apparatus - Numbers on scene by time
SLIDE 12
12
In a recent drought risk mapping was used to identify high risk areas for an education program known as “Bushfire Blitz”. Initially a 100km radius of Melbourne was identified as the area containing the highest risk…
Achieving the GIS Vision
“Expert Spatial Analysis and Services” Targeted education campaign – “Bushfire Blitz”
GIS analyses integrated fire behaviour and Census data to identify 200 towns having the highest risk…
High risk towns identified
SLIDE 13 13
GIS Services produced 200 A1 fire behaviour maps in 6 days which enabled the fine scale targeting of threatened communities …
Local risk maps printed
Bushfire Blitz in action
RESULTS
- 8 week program
- 1,400 Street
meetings
attended
treatment
SLIDE 14
14
NSW Bushfires Joint Services GIS Unit
SLIDE 15 15
Participating organizations Government: NSW Rural Fire Service NSW Fire Brigades NSW National Parks and Wildlife Service NSW SES Victorian DSE Fire Management Victorian CFA Private: Lagen Spatial MapInfo Image Analysis and Mapping Air Target Services Rapid Map Global
The set up:
11 Organizations 55 people in total Full deployment – 18 days Hours of operation 2:00 AM – 10:00 PM
The skill sets:
GIS Cartography Image interpretation and analysis GPS field data collection Programming Web development Wildfire Science
SLIDE 16
16
The Products
Detailed topographic maps Overview of fire situation including maps, area and perimeter statements Digital library of loss information Development of Intranet mapping facility to enhance distribution of products
Operational Maps
SLIDE 17
17
Strategic maps “Tourist” maps
SLIDE 18
18
Loss register - Intranet Lessons learnt for future emergency GIS deployment
SLIDE 19 19
“Investigating use of GIS in response to the attack on New York City”
Victorian Emergency Services Foundation Scholarship July - August 2002
SLIDE 20 20
GIS Products – Air photo’s
Photo courtesy FDNY Photo courtesy FDNY
GIS Products – Grid maps
Map courtesy FDNY Map courtesy FDNY
SLIDE 21 21
GIS Products – Thermal Imagery
Map courtesy FDNY Map courtesy FDNY
GIS Products – Informative maps for the Public
Map courtesy FDNY Map courtesy FDNY
SLIDE 22 22
GIS Products – Models and analyses Report to Victorian Emergency Services Foundation
- Summary of GIS activities reported
- Innovative use of GIS noted
- Recommendations with respect to
Victoria made
- How to operate a GIS at a large incident assessed
SLIDE 23 23
Advice - examples
Fly aerial photography early in the incident and fly
Map courtesy FDNY Map courtesy FDNY
Advice - examples
Prepare a purpose built electronic map request system
SLIDE 24 24
Advice - examples
A single integrated database utilizing an effective data model is required for large incidents
FIRE may be identified as part of a FIRE COMPLEX may be identified as part of a ENTITY relationship Participation Cardinality Participation Cardinality Symbol must
must many may
may many
Key:
{name} GPS LOG may indicate the geometry of a may be identified as belonging to a BURNT AREA FIREMAP CD MAP may indicate the geometry of a Hand drawn annotation on a paper map may indicate the geometry
a may indicate the geometry of a FIRE LINE may be identified as belonging to a may indicate the geometry of a may indicate the geometry of a MISCELLANEOUS/ OTHER SPOT FIRE may be identified as belonging to a must be identified a s belonging to a THERMAL IMAGE may indicate the geometry of a may indicate the geometry of a
datetime accuracy/certaintity FIRE GROUND MANAGEMENT OBJECT Notes: * All entities are to have a created_date attribute which automically records the date/time the instance was created. * Current ? * Change log. Everytime a field value is changed from a pre-existing value this fact needs to be recorded including the old value. * Fire naming convention in relation to IMS * Automate mapping of georeference in IMS. * Use of existing geometry to create new geographic features. type:
Line
Boundary
Boundary
Spot status (planned, completed.) {name} POO start date/time burnt area(derived) perimeter length(derived) may be linked to many GENERAL OPERATIONS OBJECT type:
Area
Ground
- Helipad
- Water points
- Refuge Area
- Strike Team
- Aircraft
status (operational, non-
accuracy/certaintity
- bserved/predicted datetime
type (active, in-active, predicted) fire line based
(type=predicted
IMT may manage many BACKBURN may indicate the geometry of a may indicate the geometry
a point
accuracy/certaintity polygon point / line or polygon point / line or polygon CONTAINMENT LINE line accuracy/certaintity type(dozer, rakehoe, road,.. ) status (future,in-progress,complete) first_ignition_datetime name line
Advice - examples
Deliver more electronic maps and less paper maps
SLIDE 25
25
CFAs GIS Unit CFA initially assisted DSE Fire Management (Public Land Fire Management Agency) GIS effort both in Melbourne and in the field After the fires had been running for a week CFA required it’s own GIS capacity to support both Operational and Community Safety programs
SLIDE 26
26
CFA GIS Unit Located in Melbourne behind the central operations room As the fires grew the GIS Unit expanded; Additional support was requested from outside CFA Office of the Emergency Services Commissioner Deakin University RMIT Frankston City Council VicRoads
Expandable GIS staff management model developed and used
SLIDE 27
27
The audience for GIS products: Operational planners, firefighters Fire industry partners e.g. plantation and power companies The community Government – Ministers, Commissioners, Advisers The media Data combined in an Access Database to keep track of incoming/outgoing data (versioning)
SLIDE 28 28
The Products Maps - Overview of strategic fire situation including maps, area and perimeter statements Data - fire perimeter data accessible via an FTP site so others could use data in their own system Statistics - Areas, spread rates Analyses - Risk identification such as schools, hospitals and chemical plants in the fire path Community information hotlines
taking facility
latest maps
- Web-site access
- Situation reports
- n individual fires
- Maps – pdf’s
, jpegs
SLIDE 29
29
Many materials publicly accessible via Internet Planning - pre-calculated fire models
SLIDE 30 30
Planning – dwelling locations in fire path Planning – Risk identification Schools w ithin 70 Km
SLIDE 31
31
Planning – Resource depletion Local operational Mapping support – Lysterfield fires
SLIDE 32
32
Media Products – Biggest fire since … Your Colony of Victoria…
SLIDE 33
33
Quotable Quotes Victorian Alpine Fires 2003
SLIDE 34
34
Victorian Alpine Fires 2003 Victorian Alpine Fires 2003
SLIDE 35
35
Fire area comparison - North Island Fire area comparison – South Island
SLIDE 36 36
Source: “Economic costs of natural disasters in Australia” Bureau of Transport Economics, 2001
Cyclone Tracy Ash Wednesday Bushfires New castle Earthquake Sydney Hailstorm
SLIDE 37 37
EM use of GIS has increased markedly in past five years 1998 Sydney Hailstorm
During this incident a “Joint Services” GIS Unit was created to manage the thousands of calls for assistance. Staff were sourced from several agencies including the NSW State Emergency Service, the NSW Fire Brigade and NSW Rural Fire Service.
SLIDE 38 38
- In 1999 the Victorian Emergency Services GIS
User Group was formed
- Police, Fire, Ambulance, State Emergency
Service, ES Commissioner and Land Victoria are members and meet every two months
ESSIC and was created in NSW The Victorian EM GIS User Group:
- Runs workshops for operational staff
- Shares data and resources
- Plays an advocacy role on state GIS issues
- Joint operations during large events
- Have prepared information papers giving
- pinions on Vic Govt. spatial information
policies
- e.g. Access to spatial information
- e.g. Use of common projections
and datums
SLIDE 39 39
One example of the success of the Vic EM GIS User Group is that all the Emergency Services use a common digital topographic map set known as “FireMap CD”. Statewide 1:25,000 Digital Topographic Maps.
Victoria Police Metropolitan Fire Brigade DSE Fire Management Metropolitan Ambulance Service Rural Ambulance Service State Emergency Service Parks Victoria Country Fire Authority
Used by all ESO’s
SLIDE 40 40
Fire, Flood and Search and Rescue Map Templates Common Symbology
A workshop with 80 participants was held in Canberra in October 2001. A national Emergency Management GIS User Group “EMSINA” was formed
SLIDE 41 41
- Other states formed their own GIS User Groups
- Queensland, South Australia, Western Australia,
Tasmania, New South Wales, ACT and Victoria all participate in EMSINA
- Three federal agencies joined EMSINA:
– Emergency Management Australia – Geoscience Australia – Bureau of Meteorology Typical Agenda Items at EMSINA
- Common Symbology
- Comparison of State Data Supply Arrangements
- State GIS ES Projects - Develop database
- Run GIS Workshop at a Disaster Management
Conference
- Share ideas and technology
SLIDE 42 42
EMSINA submission to Council of Australian Governments (COAG) Bushfire Inquiry
EMSINA example
“Improvements at local and state levels in the coordination and use of GIS are likely to deliver short-term improvements in information management however true benefits are to be derived from the longer- term strategic improvements. No one agency or state can do this on it’s
Gravelly Ridge Fire – Fire Boundary 16 November 2002
Task: Gravelly Ridge View: 15 Oct 1630 Printed: 15 -1 1-2002 16:22 By: DvG
Share technology in the form of
mapping systems from different states
Technology
SLIDE 43 43
GIS Staff shared across and within states during recent counter terrorism exercises e.g. Operation Labyrinth in Melbourne where the three state fire services (MFB, CFA and DSE) were involved
Staff
Emergency Management GIS is not just about bits and bytes and wires and databases ... It’s about creating a network for emergency management personnel to use GIS effectively
SLIDE 44
44
EMSINA – a network of people creating the capacity of EM workers to use spatial information tools
For further information see: www.emsina.net NB: Site being built
SLIDE 45
45