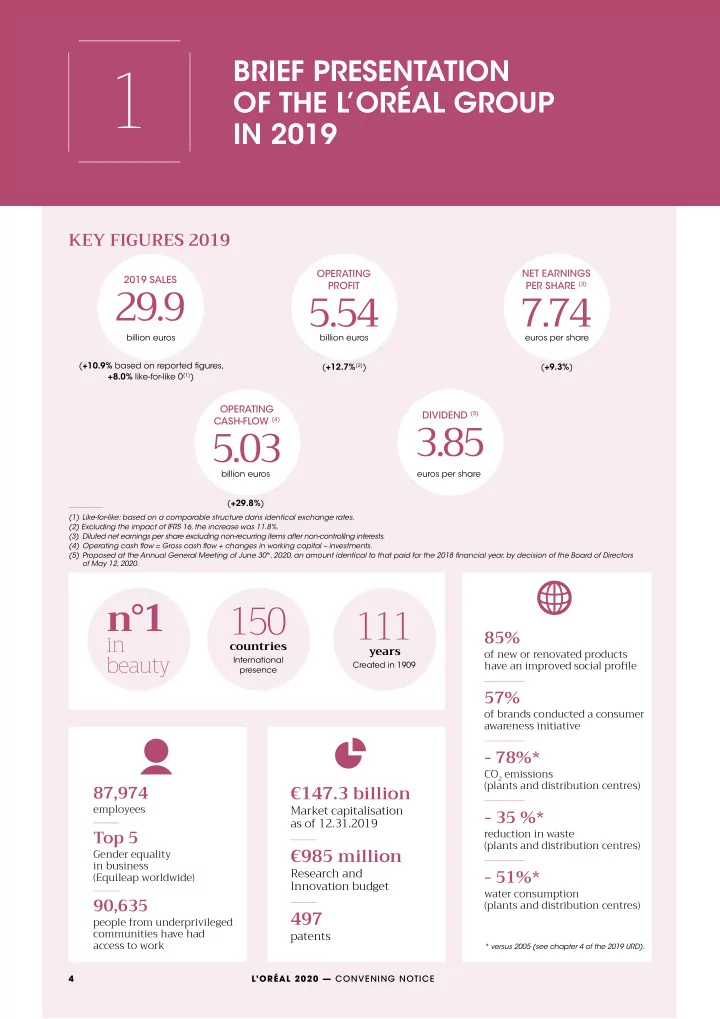
1 BRIEF PRESENTATION OF THE LORAL GROUP IN 2019 KEY FIGURES 2019 - - PDF document

1
SMART_READER_LITE
LIVE PREVIEW

1 BRIEF PRESENTATION OF THE LORAL GROUP IN 2019 KEY FIGURES 2019 - - PDF document

1 BRIEF PRESENTATION OF THE LORAL GROUP IN 2019 KEY FIGURES 2019 OPERATING NET EARNINGS 29.9 2019 SALES 5.54 7.74 PROFIT PER SHARE (3) billion euros billion euros euros per share ( +10.9% based on reported fjgures, ( +12.7% (2) )


slide-1
SLIDE 1

1

BRIEF PRESENTATION OF THE L’ORÉAL GROUP IN 2019

KEY FIGURES 2019

(1) Like-for-like: based on a comparable structure dans identical exchange rates. (2) Excluding the impact of IFRS 16, the increase was 11.8%. (3) Diluted net earnings per share excluding non-recurring items after non-controlling interests. (4) Operating cash fmow = Gross cash fmow + changes in working capital – investments. (5) Proposed at the Annual General Meeting of June 30th, 2020, an amount identical to that paid for the 2018 fjnancial year, by decision of the Board of Directors

  • f May 12, 2020.

2019 SALES

29.9

billion euros (+10.9% based on reported fjgures, +8.0% like-for-like 0(1))

OPERATING PROFIT

5.54

billion euros (+12.7%(2))

NET EARNINGS PER SHARE (3)

7.74

euros per share (+9.3%)

OPERATING CASH-FLOW (4)

5.03

billion euros (+29.8%)

85%

  • f new or renovated products

have an improved social profjle

57%

  • f brands conducted a consumer

awareness initiative

  • 78%*

CO2 emissions (plants and distribution centres)

  • 35 %*

reduction in waste (plants and distribution centres)

  • 51%*

water consumption (plants and distribution centres)

* versus 2005 (see chapter 4 of the 2019 URD).

w

€147.3 billion

Market capitalisation as of 12.31.2019

€985 million

Research and Innovation budget

497

patents

8

87,974

employees

Top 5

Gender equality in business (Equileap worldwide)

90,635

people from underprivileged communities have had access to work

111

years

Created in 1909

150

countries

International presence

n°1

in beauty

euros per share

DIVIDEND (5)

3.85

L’ORÉAL 2020 — CONVENING NOTICE 4

slide-2
SLIDE 2

NORTH AMERICA WESTERN EUROPE

€7,567.0M

SALES

€8,277.1M

SALES

25.3% share of Group sales

  • 0,8% sales evolution in 2019 (1)

27.7% share of Group sales +1,8% sales growth in 2019 (1)

€9,658.0M

SALES

ASIA PACIFIC

32.3% share of Group sales +25.5% sales growth in 2019 (1)

€1,909.7M

SALES

EASTERN EUROPE

6.4% share of Group sales +9.0% sales growth in 2019 (1)

€688.7M

SALES

AFRICA, MIDDLE-EAST

2.3% share of Group sales

  • 4.1% sales evolution

in 2019 (1)

LATIN AMERICA

6.0% share of Group sales +2.0% sales growth in 2019 (1)

€1,773.1M

SALES

€14,029.5M

SALES

47.0% share of Group sales +17.9% sales growth in 2019 (1) (1) Like-for-like sales growth: based on a comparable structure and identical exchange rates.

NEW MARKETS

(1) Like-for-like sales growth: based on a comparable structure and identical exchange rates.

L’ORÉAL 2020 — CONVENING NOTICE 5

1

BRIEF PRESENTATION OF THE L’ORÉAL GROUP IN 2019 Key fjgures 2019

slide-3
SLIDE 3

COMMENTS

The Board of Directors of L’Oréal met on 6 February 2020, under the chairmanship of Jean-Paul Agon and in the presence

  • f the Statutory Auditors. The Board closed the consolidated fjnancial statements and the fjnancial statements for 2019.

(1) Like-for-like sales growth: based on a comparable structure and identical exchange rates. (2) Sales achieved on our brands’ own websites + estimated sales made by our brands corresponding to sales through our retailers’ websites (non-audited data); like-for-like growth. (3) The CDP is an independent NGO which offers a global system for the measurement and publication of environmental information and which assesses the strategy, close involvement and results obtained by companies in the fjght against climate change, sustainable water management and forest protection.

L’Oréal closed the decade with its best year for sales growth since 2007, at +8.0% like-for-like (1), and an excellent fourth quarter, in a beauty market that remains very dynamic. All Divisions are growing. L’Oréal Luxe sales exceeded 11 billion euros, driven by the strong dynamism of its four big brands – Lancôme, Yves Saint Laurent, Giorgio Armani and Kiehl’s – which all posted double-digit growth. The Active Cosmetics Division had its best year ever, with La Roche-Posay sales exceeding one billion euros. Growth at the Consumer Products Division was boosted by L’Oréal Paris which had a great year. Lastly, growth improved in the Professional Products Division; the highlight was the double-digit performance of Kérastase. Performances by geographic Zone were contrasted. The New Markets posted their strongest growth for more than 10 years(1). Asia Pacifjc became the Group’s number one Zone, with a remarkable end to the year in China, but also good growth in South Korea, India, Indonesia and Malaysia. Eastern Europe maintained its strong growth rate, and Western Europe returned to growth last year. North America was impacted by the poor performance in makeup. E-commerce (2) and Travel Retail, which are also powerful growth drivers, contributed strongly to the Group’s success. E-commerce grew spectacularly by +52.4% and accounts for 15.6% of sales. Travel Retail maintained its strong momentum and posted growth of +25.3% (1). 2019 also saw good growth in our profjts. The strong growth in sales and the increase in gross profjt, combined with the lower weight of operating expenses, enabled us both to invest more in our brands and to improve our profjtability. Once again this year, the strength of L’Oréal’s well-balanced business model paid off. It is the universal presence of L’Oréal, which covers the whole beauty market, combined with its talented teams all over the world, which enable the Group to keep on achieving profjtable and sustainable growth, while again strengthening its position as the beauty market leader. Meanwhile, in a world that was hit particularly hard by climate- related uncertainties in 2019, L’Oréal is continuing its initiatives to promote responsible and sustainable growth. For the fourth consecutive year, CDP (3) awarded the Group three A ratings for its initiatives in tackling climate change, sustainable water management and combating deforestation. L’Oréal was also recognised, for the tenth time, as one of the world’s most ethical companies by Ethisphere Institute. And lastly, the Group is playing a major role in gender equality, and its leadership in this fjeld has been recognised by Equileap and

  • Bloomberg. These extra-fjnancial performances are a source
  • f pride for the Group, which is fjrmly committed to promoting

a responsible and sustainable model. 2019 SALES By division By Geographic Zone By currency

L’Oréal Luxe 36.9% Active Cosmetics 8.9% Professional Products 11.5% Consumer Products 42.7% New Markets 47.0% Of which: Asia-Pacific 32.3% Eastern Europe 6.4% Africa, Middle East 2.3% Latin America 6.0% Western Europe 27.7% North America 25.3% Other currencies 36.7% Of which: Mexican peso 1.5% Japanese yen 1.8% Russian rouble 2.5% Canadian dollar 2.3% Brazilian real 2.2% Other 26.4% Euro 21.7% Dollar 23.5% Chinese yuan 13.8% Pound sterling 4.3%

L’ORÉAL 2020 — CONVENING NOTICE 6

1

BRIEF PRESENTATION OF THE L’ORÉAL GROUP IN 2019 Comments

slide-4
SLIDE 4

2019 SALES

Like-for-like, i.e. based on a comparable scope of consolidation and constant exchange rates, the sales growth

  • f the L’Oréal group was +8.0%.

The net impact of changes in the scope of consolidation amounted to +0.8%. Growth at constant exchange rates was +8.8%. At the end of 2019, currency fmuctuations had a positive impact of +2.1%. Based on reported fjgures, the Group’s sales, at 31 December 2019, amounted to 29.87 billion euros, an increase of +10.9%. SALES BY DIVISION AND GEOGRAPHIC ZONE

€ millions 2017 2018 2019 % 2019 sales 2018/2019 progression Like-for-like Reported fjgures BY DIVISION Professional Products 3,350.4 3,262.5 3,441.9 11.5% +3.2% +5.5% Consumer Products 12,118.7 12,032.2 12,748.2 42.7% +3.3% +6.0% L’Oréal Luxe 8,471.7 9,367.2 11,019.8 36.9% +13.8% +17.6% Active Cosmetics 2,082.9 2,275.5 2,663.7 8.9% +15.5% +17.1% Group total 26,023.7 26,937.4 29,873.6 100% +8.0% +10.9% BY GEOGRAPHIC ZONE Western Europe 8,125.3 8,065.1 8,277.1 27.7% +1.8% +2.6% North America 7,350.5 7,234.3 7,567.0 25.3%

  • 0.8%

+4.6% New Markets, of which: 10,547.8 11,638.1 14,029.5 47.0% +17.9% +20.5%

  • Asia, Pacifjc

6,151.8 7,405.6 9,658.0 32.3% +25.5% +30.4%

  • Latin America

(1)

1,952.9 1,784.8 1,773.1 6.0% +2.0%

  • 0.7%
  • Eastern Europe

1,750.8 1,754.2 1,909.7 6.4% +9.0% +8.9%

  • Africa, Middle East

692.4 693.5 688.7 2.3%

  • 4.1%
  • 0.7%

GROUP TOTAL 26,023.7 26,937.4 29,873.6 100% 8.0% +10.9%

The fjnalisation of the disposal of The Body Shop on 7 September 2017 lead to the application, in 2017, of IFRS 5 for discontinued operations. (1) The Group has applied IAS 29 (Financial Reporting in Hyperinfmationary Economies) to Argentina since 1 July 2018. The negative impact of this adjustment is 340 basis points

  • n like-for-like growth in Latin America and 20 basis points on that of the entire L’Oréal Group in 2019.

2019 sales

Professional products

The Professional Products Division recorded annual growth

  • f +3.2% like-for-like and +5.5% based on reported fjgures.

Consumer products

The Consumer Products Division ended the year at +3.3% like-for-like and +6.0% based on reported fjgures.

L’Oréal luxe

L’Oréal Luxe has grown by +13.8% like-for-like and +17.6% based on reported fjgures.

Active cosmetics

The Active Cosmetics Division achieved record growth of +15.5% like-for-like, the Division’s highest growth rate for 20 years. Growth based on reported fjgures is at +17.1%.

Summary by Geographic Zone

Western Europe

The Zone recorded growth of +1.8% like-for-like and +2.6% based on reported fjgures.

North America

The Zone is at -0.8% like-for-like and +4.6% based on reported fjgures, with contrasting performances across the Divisions.

New markets

Asia Pacifjc: the Zone grew by +25.5% like-for-like and +30.4% based on reported fjgures. Latin America: the Zone is at +2.0% like-for-like and -0.7% based on reported fjgures. Eastern Europe: the Zone recorded growth of +9.0% like-for-like and +8.9% based on reported fjgures, driven by Russia, Turkey, Ukraine and Romania. Africa, Middle East: the Zone is at -4.1% like-for-like and -0.7% based on reported fjgures. The Zone was affected by a sharp fourth-quarter deceleration in the countries of the Levant, and Lebanon in particular.

L’ORÉAL 2020 — CONVENING NOTICE 7

1

BRIEF PRESENTATION OF THE L’ORÉAL GROUP IN 2019 2019 Sales

slide-5
SLIDE 5

2019 RESULTS

Operating profjtability at 18.6% of sales

OPERATING PROFITABILITY AND CONSOLIDATED INCOME STATEMENT 2017 2018 2019 €m % sales €m % sales €m % sales Sales 26,023.7 100.0% 26,937.4 100.0% 29,873.6 100.0% Cost of sales

  • 7,359.2

28.3%

  • 7,331.6

27.2%

  • 8,064.7

27.0% Gross profjt 18,664.5 71.7% 19,605.8 72.8% 21,808.9 73.0% R&I expenses

  • 877.1

3.4%

  • 914.4

3.4%

  • 985.3

3.3% Advertising and promotion expenses

  • 7,650.6

29.4%

  • 8,144.7

30.2%

  • 9,207.8

30.8% Selling, general and administrative expenses

  • 5,460.5

21.0%

  • 5,624.7

20.9%

  • 6,068.3

20.3% OPERATING PROFIT 4,676.3 18.0% 4,922.0 18.3% 5,547.5 18.6%

The fjnalisation, on 7 September 2017, of the disposal of The Body Shop leads to account for the businesses sold, for 2017, in accordance with the IFRS 5 accounting rule on discontinued operations. For consistency with the fjnancial information given outside the fjnancial statements below, please refer to the tables published in the 2017 Registration Document (chapter 4, page 223) describing the fjnancial performance of the Group when The Body Shop was an integral part of its continuing operations.

Gross profjt, at 21,808 million euros, came out at 73.0% of sales, compared with 72.8% in 2018, which is an improvement

  • f 20 basis points.

Research and Development expenses, at 985 million euros, have increased by 7.8% compared with 2018. Advertising and promotion expenses increased by 60 basis points, at 30.8% of sales. Selling, general and administrative expenses, at 20.3% of sales, have been reduced by 60 basis points. Overall, operating profjt has grown by +12.7% to 5,547 million euros, and amounts to 18.6% of sales, representing an increase of 30 basis points. Excluding the impacts of applying the IFRS 16 accounting rule, this growth amounted to 11.8%.

Operating profjt by Division

2017 2018 2019 €m % sales €m % sales €m % sales Professional Products 669 20.0% 652 20.0% 691 20.1% Consumer Products 2,419 20.0% 2,428 20.2% 2,575 20.2% L’Oréal Luxe 1,856 21.9% 2,072 22.1% 2,494 22.6% Active Cosmetics 471 22.6% 523 23.0% 621 23.3% DIVISIONS TOTAL 5,415 20.8% 5,675 21.1% 6,381 21.4% Non-allocated (1)

  • 739
  • 2.8%
  • 753
  • 2.8%
  • 833
  • 2.8%

GROUP 4,676 18.0% 4,922 18.3% 5,548 18.6%

(1) Non-allocated = Central Group expenses, fundamental research expenses, free grant of shares expenses and miscellaneous items. As a % of sales.

The profjtability of the Professional Products Division came

  • ut at 20.1%, an improvement of 10 basis points.

The profjtability of the Consumer Products Division was stable at 20.2%. The profjtability of L’Oréal Luxe, at 22.6%, increased by 50 basis points. The profjtability of the Active Cosmetics Division came out at 23.3%, representing an increase of 30 basis points. Non-allocated expenses amounted to 833 million euros, which is stable in relative value.

L’ORÉAL 2020 — CONVENING NOTICE 8

1

BRIEF PRESENTATION OF THE L’ORÉAL GROUP IN 2019 2019 Results

slide-6
SLIDE 6

Net profjt

Consolidated profjt and loss accounts: from operating profjt to net profjt excluding non-recurring items.

NET PROFIT From operating profjt to net profjt excluding non-recurring items:

€m 2017 2018 2019 Growth Operating profjt 4,676.3 4,922.0 5,547.5 +12.7% Financial revenues and expenses excluding Sanofj dividends

  • 22.9
  • 1.9
  • 62.7

Sanofj dividends 350.0 358.3 363.0 Profjt before tax excluding non-recurring items 5,003.3 5,278.4 5,847.9 +10.8% Income tax excluding non-recurring items

  • 1,250.5
  • 1,286.8
  • 1,486.7

Net profjt excluding non-recurring items of equity consolidated companies

  • 0.1

+0.1 +1.0 Non-controlling interests

  • 3.9
  • 4.1
  • 5.4

Net profjt excluding non-recurring items 3,748.7 3,987.6 4,356.9 +9.3% EPS (1) (€) 6,65 7.08 7.74 +9.3% NET PROFIT AFTER NON-CONTROLLING INTERESTS 3,581.4 3,895.4 3,750.0 Diluted EPS after non-controlling interests (€) 6.36 6.92 6.66 Diluted average number of shares 563,528,502 563,098,506 562,813,129

(1) Diluted earnings per share, based on net profjt, excluding non-recurring items, after non-controlling interests. (1) Non-recurring items include impairment of assets, net profjt of discontinued operations, restructuring costs and tax effects of non-recurring items. (2) Operational cash fmow = Gross cash fmow + changes in working capital - capital expenditure.

Net fjnance costs amount to 62 million euros, of which 54 million euros is the result of applying the IFRS 16 accounting rule. Sanofj dividends amounted to 363 million euros. Income tax excluding non-recurrent items amounted to 1,486 million euros, representing a tax rate of 25.4%. Net profjt excluding non-recurring items after non-controlling interests amounted to 4,356 million euros, an increase of +9.3%. Earnings per share, at 7.74 euros, is up by +9.3%. Non-recurring items after non-controlling interests (1) amounted to 606 million euros net of tax. Net profit after non-controlling interests (1) came out at 3,750 million euros.

Cash fmow statement, Balance sheet and Cash position

Gross cash fmow amounted to 5,802 million euros, an increase

  • f 12.1%.

The working capital requirement decreased by 460 million euros. At 1,230 million euros, investments represented 4.1% of sales. Net cash fmow (2) at 5,031 million euros, increased by 29.8%. The balance sheet is particularly solid, with shareholders’ equity amounting to 29.4 billion euros. After allowing for fjnance lease liabilities in an amount of 2,035 million euros, net cash came out at 2,399 million euros at 31 December 2019.

Proposed dividend at the General Meeting of June 30th, 2020

The Board of Directors has decided to propose to the shareholders’ General Meeting of June 30th, 2020 a dividend

  • f 3.85 euros, an amount identical to that paid for the

2018 fjnancial year, by decision of the Board of Directors

  • f May 12, 2020. The dividend will be paid on July 7th, 2020

(ex-dividend date July 3rd, 2020 at 0:00 a.m., Paris time).

Share capital

At 31 December 2019, the capital of the company is formed by 558,117,205 shares, each with one voting right.

L’ORÉAL 2020 — CONVENING NOTICE 9

1

BRIEF PRESENTATION OF THE L’ORÉAL GROUP IN 2019 2019 Results