1
play

1 Relevance of local IgE synthesis The ontogeny of memory IgE - PDF document

Basic Immunology: IgE Memory Hannah Gould School of Basic and Biomedical Sciences Kings College London Importance of Bone Marrow Plasma Cells in IgE Memory Our Projectory Holt et al . Long-lived IgE and IgG-secreting cells in


  1. Basic Immunology: IgE Memory Hannah Gould School of Basic and Biomedical Sciences King’s College London Importance of Bone Marrow Plasma Cells in IgE Memory Our “ Projectory ” • Holt et al . Long-lived IgE and IgG-secreting cells in • Look back at some of our earlier work relating to rodents manifesting persistent antibody responses. IgE plasma cells in the respiratory tract Cellular Immunol 89, 281-8, 1984 • Eckle-Dorna et al ., The majority of allergen-specific • Describe ongoing studies by next generation IgE in the blood of allergic patients does not originate from blood-derived B cells or plasma cells. Clin Exp sequencing (NGS) of the expressed immunoglobulin Allergy 42, 137-55 , 2012 genes in rhinitis, asthma • Luger et al . Induction of long-lived allergen-specific plasma cells by mucosal allergen challenge. J Allergy • End with possible implications of results for future
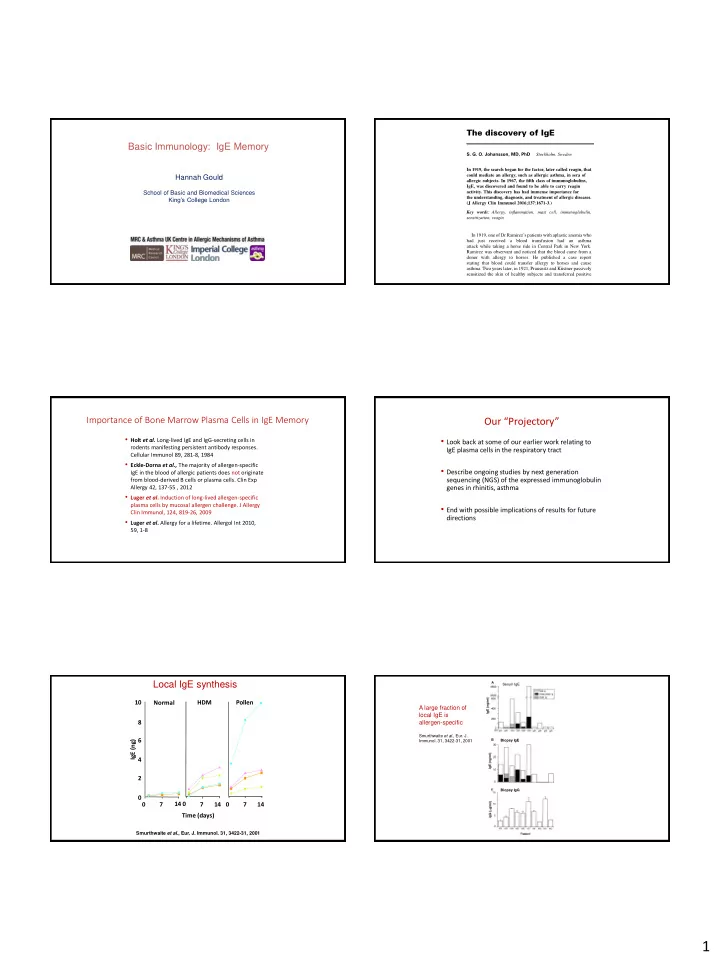
 Clin Immunol, 124, 819-26, 2009 directions • Luger et al . Allergy for a lifetime. Allergol Int 2010, 59, 1-8 Local IgE synthesis Serum IgE 10 Normal HDM Pollen A large fraction of local IgE is 8 allergen-specific Smurthwaite et al ., Eur. J. 6 IgE (ng) Immunol. 31, 3422-31, 2001 Biopsy IgE 4 2 Biopsy IgG 0 14 0 0 7 7 14 0 7 14 Time (days) Smurthwaite et al ., Eur. J. Immunol. 31, 3422-31, 2001 1

  2. Relevance of local IgE synthesis The ontogeny of memory IgE plasma cells • Rate of IgE synthesis ex vivo = 3.6x10 9 molecules/day/mm 3 • Rate of loss of IgE from mast cells = 10 7 molecules/day/mm 3 • What drives these events and what are the Assumptions: 1. number of mast cells/mm 3 underlying mechanisms and functional 2. number of IgE receptors/mast cell outcomes? 3. rate of dissociation of IgE from mast cells in tissues • What can we learn from next generation • IgE synthesis = 3.6x10 9 >> IgE loss = 10 7 sequencing(NGS) of the B cell repertoires? molecules/day/mm 3 • Conclusion: Local IgE Production is 100X more than required to saturate the mast cells in the tissue and maintain immediate hypersensitivity. Gould et al . , Annu Rev Immunol 2003, 21: 579-628 Using the junctional sequences to identify clonal families Complementarity determining region (CDR) Framework region (FR) FR1 CDR1 FR2 CDR2 FR3 CDR3 Family trees reveal clonal lineage and relationships Direct & sequential switching to IgE Germ Line Number of mutations 10 Clonally related sequences Low mutation Sequence alignment against germ line Same CDR-H3 Same VDJ rearrangements High mutation Variants with different mutations and isotypes Xiong et al., J. Exp. Med. 2012; 209: 353-642 11 2

  3. Characteristics of clonal trees Mining data from 4 different studies • Influence of seasonal exposure to grass pollen on local tissue and peripheral blood IgE repertoires in patients with allergic rhinitis. Wu et al ., J Allergy Clin Immunol 134, 604-12, 2014 • Antibodies and superantibodies in patients with chronic rhinosinusitis with nasal polyps. Chen et al ., J Allergy Clin Immunol 138, 1195-204, 2016 • Relation between the B cell repertoire, local inflammation and the clinical response to allergen in allergic rhinitis. James et al ., in progress • Both local and distant connectivity between immunoglobulin clones in the human lung mucosa revealed by new generation sequencing. Ohm-Laursen et al ., in progress NGS 2014 Sanger sequencing 2003 1,318 Vε cDNA sequences 120 Vε cDNA sequences Nasal mucosa of 7 patients Nasal mucosa of 6 patients 3 IgE clonal families 295 IgE clonal families Relative frequency of somatic hypermutation Levels of somatic hypermutation Clones from peripheral blood & nasal biopsy pooled Wu et al ., JACI 2014; 134: 604-12 Wu et al . JACI 2014; 134: 604-12 ” Connectivity” B cell repertoire in asthma Ohm-Laursen et al ., in progress Ohm-Laursen et al ., in progress 3

  4. Expected hot spots of mutation Levels of somatic hypermutation in lung vs . blood in different isotypes B A • Ohm-Laursen et al. , in progress Is the response Ag-driven? Kleinstein, Meng et al ., unpublished results Sampling and saturation of the repertoire AA Lung NANA Lung % of total number of unique clones % of total number of unique clones 206 408 604 786 947 1112 1288 1439 1580 1719 100 239 519 742 957 1162 1366 1554 1727 1923 2090 100 80 80 60 60 40 40 20 20 0 0 1 2 3 4 5 6 7 8 9 10 1 2 3 4 5 6 7 8 9 10 Number of Biopsies Number of Biopsies Ohm-Laursen et al. , unpublished results Ohm-Laursen et al. , unpublished results 4

  5. Summary with Questions: Ontogeny of IgE B cells? The respiratory tract mucosa is a site for the development of IgE plasma cells. • B cells migrate into the mucosa and undergo (antigen-dependent?) somatic mutation and immunoglobulin class switching to multiple isotypes, including IgE. • Clonal expansion (selection?) and cell differentiation into plasma cells occurs in the mucosa. • Cells migrate out of the mucosa and may re-enter at other sites. • We don’t know the fates of all the various cells, but in immunized mice, nasal allergen challenge generates short-lived plasma cells some of which migrate to the bone marrow to become IgE memory plasma cells (Luger et al ., 2009). • We can’t rule out a contribution of local lymphoid tissue and mucosal tissue to some of these processes, e.g. class switching and somatic hypermutation • Followed by homing (chemotaxis) of selected B cell populations into the mucosa. Acknowledgements My lab (past) Clinical Colleagues Dr. Lyn Smurthwaite Dr. Pooja Takhar Prof. Stephen Durham (Imperial College London) Prof. Christopher Corrigan (King’s College London ) Dr. Heather Coker Dr. Louisa James Prof. Sebastian Johnston (Imperial College London) Dr. Jiun-Bo (Leo) Chen Dr. Harsha Kariyawasam (University College London) et al . et al . My lab (current) Biopsy donors Dr. Yu-Chang (Bryan) Wu Dr. Line Ohm-Laursen Dr. Faruk Ramadani Dr. Holly Bowen et al . Relation between clinical response to allergen and local inflammation Expected hot spots of mutation A. B. p<0.0001 50 100 0 0 D PNIF (15 mins) D PNIF -50 -100 Healthy -100 -200 Allergic -150 -300 0 5 15 30 60 120 180 240 300 360 420 480 Healthy Allergic Time (min) James et al ., in progress 5

  6. Isolation of single B cells expressing allergen specific antibodies Gene expression vs . clinical response to allergen 1600 R=-0.59 100 R=-0.59 300 R=-0.72 p=0.04 p=0.04 p=0.01 1400 80 250 1200 60 STAT3 JAK1 IL6R 1000 40 200 800 20 600 0 150 -300 -200 -100 0 100 -300 -200 -100 0 100 -300 -200 -100 0 100 Δ PNIF Δ PNIF Δ PNIF The elevated expression levels of the majority of the 47 pro-inflammatory genes in the AR patients correlated with the clinical response to allergen challenge, as exemplified here by STAT3, IL6R and JAK1. Chen etal., 2016 Spearman correlations Signature of allergic inflammation FcER1A FcGR2B CD24 PAX5 Surface CD5 IKZF1 Nanostring nCounter BCL6 CD27 Receptors Transcription CD80 CD20 STAT6 BLIMP1 Factors CD19 BATF XBP1 CS002 IL-4 IRF4 CS006 i c Human CS011 g IL-4R r e IL-21R CS020 l Al Immunology CS039 Cytokines CS041 IL-6 codeset CS010 IL-10 & Receptors CS013 (594 genes) y t h CS018 l Hea TGFβ CS031 IL-21 CS032 CS036 IL-13 LAIR1 KLRG2 CD164 CARD9 LITAF BCL6 TMEM173 TLR1 CD97 STAT3 BATF3 TNFRSF9 IL6R JAK1 CD45RB ENTPD1 CCRL2 STAT2 IL1R2 PTPN2 HLA-DRB3 HLA-DRA ITGAX GZMB LILRA3 SELL FCGR2A/C FCGR2A FCER1G CLEC4A KLRB1 IL2RB IL18RAP CD7 TGFB1 LCP2 CD53 HLA-DPB1 CD3D CCR5 TGFBI CD70 C1QB TNF IL4R CCR6 UBE2L3 ARHGDIB CXCR3 CXCL13 PD-1 TLR9 CXCR5 B cell Chemokines HLA-DR CCR6 CD45 CCR5 Activation & Receptors 47 genes were differentially expressed between allergic and non-allergic controls CD40 CCR7 CD21 CXCL12 CRACC Heat map generated in nSolver v2.0 based on p<0.05 CX3CL1 Activation of the IL-6R signaling pathway Up-regulation of Bcl-6 and IL-4R expression IL-6 IL6R JAK1 STAT3 100 300 1600 IL-6 BCL6 IL4R IL6R IL-6R p=0.04 p=0.03 p=0.02 100 400 250 p=0.001 p=0.001 p=0.04 80 1400 IL-6R TFH cell 80 200 Bcl6 250 300 60 1200 STAT3 JAK Count Count Count 60 150 Count Count Count 40 1000 200 IL-4 200 100 40 20 800 IL-4R 100 50 20 0 150 600 B cell l c l c c o i o i o l i r t g t r g r t g n e r n e r n e r Proliferation & 0 0 o l l o l l o l l 0 C A C A C A o l c Control Allergic o l i c r g i r g differentiation n t e r n t r e o l o l C A l C A l of B cells P -values were calculated with Mann-Whitney tests P -values were calculated with Mann-Whitney tests 6

  7. Enterotoxin specificity and high affinity 6 isolated SAE-specific clones Elisa SPR Chen et al ., 2016 Chen et al., 2016 Anti-enterotoxin Abs are highly mutated AA NANA Heavy chains Light chains Clone 203 1G2 1A4 1B6 1F3 2D6 IGHV mutation (%) 7.64 8.68 4.86 5.9 15 4.76 IGHJ mutation (%) 17.02 10.64 12.24 8.16 12.7 8.51 Number of mutations in IGHV 23 26 14 17 43 14 � Antibody Structure IgM IgD IgG IgA IgE 7

Download Presentation
Download Policy: The content available on the website is offered to you 'AS IS' for your personal information and use only. It cannot be commercialized, licensed, or distributed on other websites without prior consent from the author. To download a presentation, simply click this link. If you encounter any difficulties during the download process, it's possible that the publisher has removed the file from their server.

Recommend


More recommend