1 Example: Alarm Network Bayes Net Semantics Variables B: - - PDF document

1
SMART_READER_LITE
LIVE PREVIEW

1 Example: Alarm Network Bayes Net Semantics Variables B: - - PDF document

Bayes Nets: Big Picture CSE 473: Artificial Intelligence Bayes Nets Two problems with using full joint distribution tables as our probabilistic models: Unless there are only a few variables, the joint is WAY too big to represent


slide-1
SLIDE 1

1

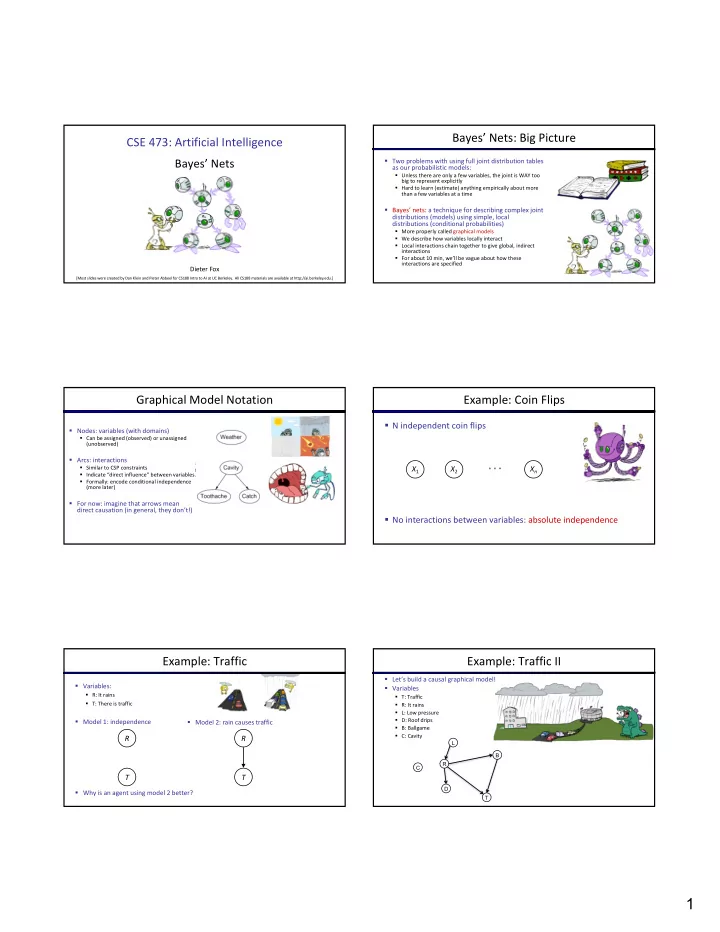
CSE 473: Artificial Intelligence Bayes’ Nets

Dieter Fox

[Most slides were created by Dan Klein and Pieter Abbeel for CS188 Intro to AI at UC Berkeley. All CS188 materials are available at http://ai.berkeley.edu.]

Bayes’ Nets: Big Picture

§ Two problems with using full joint distribution tables as our probabilistic models:

§ Unless there are only a few variables, the joint is WAY too big to represent explicitly § Hard to learn (estimate) anything empirically about more than a few variables at a time

§ Bayes’ nets: a technique for describing complex joint distributions (models) using simple, local distributions (conditional probabilities)

§ More properly called graphical models § We describe how variables locally interact § Local interactions chain together to give global, indirect interactions § For about 10 min, we’ll be vague about how these interactions are specified

Graphical Model Notation

§ Nodes: variables (with domains)

§ Can be assigned (observed) or unassigned (unobserved)

§ Arcs: interactions

§ Similar to CSP constraints § Indicate “direct influence” between variables § Formally: encode conditional independence (more later)

§ For now: imagine that arrows mean direct causation (in general, they don’t!)

Example: Coin Flips

§ N independent coin flips § No interactions between variables: absolute independence

X1 X2 Xn

Example: Traffic

§ Variables:

§ R: It rains § T: There is traffic

§ Model 1: independence § Why is an agent using model 2 better?

R T R T

§ Model 2: rain causes traffic § Let’s build a causal graphical model! § Variables

§ T: Traffic § R: It rains § L: Low pressure § D: Roof drips § B: Ballgame § C: Cavity

Example: Traffic II

T R L D B C

slide-2
SLIDE 2

2

Example: Alarm Network

§ Variables

§ B: Burglary § A: Alarm goes off § M: Mary calls § J: John calls § E: Earthquake! J A B M E

Bayes’ Net Semantics Bayes’ Net Semantics

§ A set of nodes, one per variable X § A directed, acyclic graph § A conditional distribution for each node

§ A collection of distributions over X, one for each combination of parents’ values § CPT: conditional probability table § Description of a noisy “causal” process

A1 X An

A Bayes net = Topology (graph) + Local Conditional Probabilities

P(A1 ) …. P(An )

Probabilities in BNs

§ Bayes’ nets implicitly encode joint distributions

§ As a product of local conditional distributions § To see what probability a BN gives to a full assignment, multiply all the relevant conditionals together: § Example:

Probabilities in BNs

§ Why are we guaranteed that setting results in a proper joint distribution? § Chain rule (valid for all distributions): § Assume conditional independences: à Consequence: § Not every BN can represent every joint distribution

§ The topology enforces certain conditional independencies Only distributions whose variables are absolutely independent can be represented by a Bayes’ net with no arcs.

Example: Coin Flips

h 0.5 t 0.5 h 0.5 t 0.5 h 0.5 t 0.5

X1 X2 Xn

slide-3
SLIDE 3

3

Example: Traffic

R T

+r 1/4

  • r

3/4 +r +t 3/4

  • t

1/4

  • r

+t 1/2

  • t

1/2

Example: Alarm Network

Burglary Earthqk Alarm John calls Mary calls B P(B) +b 0.001

  • b

0.999 E P(E) +e 0.002

  • e

0.998 B E A P(A|B,E) +b +e +a 0.95 +b +e

  • a

0.05 +b

  • e

+a 0.94 +b

  • e
  • a

0.06

  • b

+e +a 0.29

  • b

+e

  • a

0.71

  • b
  • e

+a 0.001

  • b
  • e
  • a

0.999 A J P(J|A) +a +j 0.9 +a

  • j

0.1

  • a

+j 0.05

  • a
  • j

0.95 A M P(M|A) +a +m 0.7 +a

  • m

0.3

  • a

+m 0.01

  • a
  • m

0.99

Example: Traffic

§ Causal direction

R T

+r 1/4

  • r

3/4 +r +t 3/4

  • t

1/4

  • r

+t 1/2

  • t

1/2 +r +t 3/16 +r

  • t

1/16

  • r

+t 6/16

  • r
  • t

6/16

Example: Reverse Traffic

§ Reverse causality?

T R

+t 9/16

  • t

7/16 +t +r 1/3

  • r

2/3

  • t

+r 1/7

  • r

6/7 +r +t 3/16 +r

  • t

1/16

  • r

+t 6/16

  • r
  • t

6/16

Causality?

§ When Bayes’ nets reflect the true causal patterns:

§ Often simpler (nodes have fewer parents) § Often easier to think about § Often easier to elicit from experts

§ BNs need not actually be causal

§ Sometimes no causal net exists over the domain (especially if variables are missing) § E.g. consider the variables Traffic and Drips § End up with arrows that reflect correlation, not causation

§ What do the arrows really mean?

§ Topology may happen to encode causal structure § Topology really encodes conditional independence

Size of a Bayes’ Net

§ How big is a joint distribution over N Boolean variables?

2N

§ How big is an N-node net if nodes have up to k parents?

O(N * 2k+1)

§ Both give you the power to calculate § BNs: Huge space savings! § Also easier to elicit local CPTs § Also faster to answer queries (coming)

slide-4
SLIDE 4

4

Bayes’ Nets

§ So far: how a Bayes’ net encodes a joint distribution § Next: how to answer queries about that distribution

§ Today:

§ First assembled BNs using an intuitive notion of conditional independence as causality § Then saw that key property is conditional independence

§ Main goal: answer queries about conditional independence and influence

§ After that: how to answer numerical queries (inference)