
SLIDE 1
1
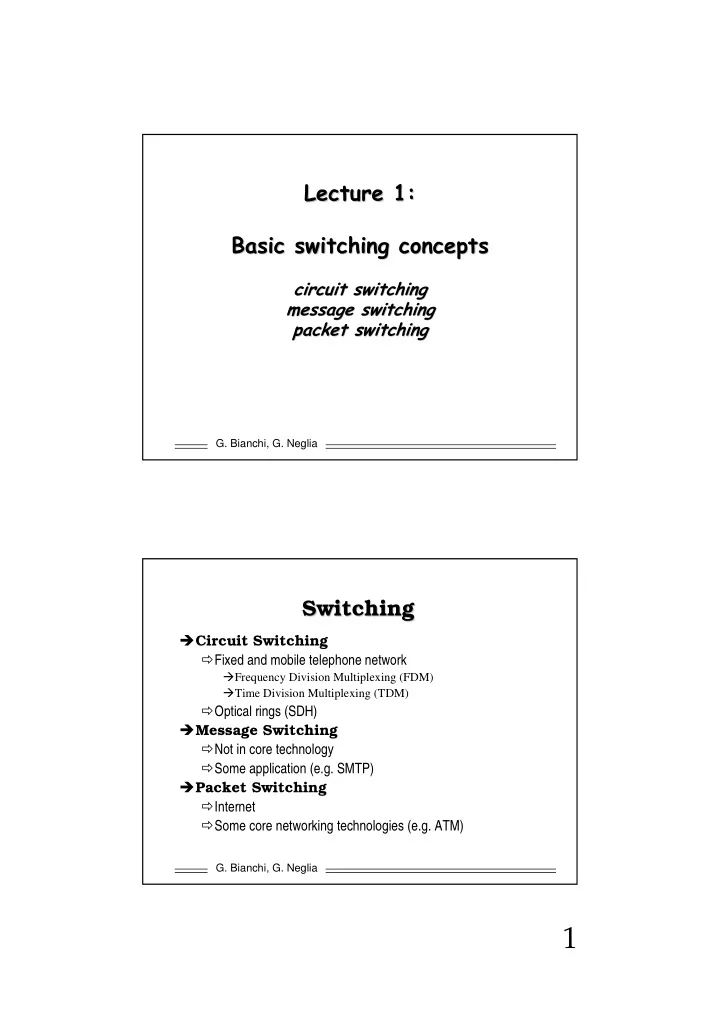
- G. Bianchi, G. Neglia
- G. Bianchi, G. Neglia
1 Circuit Switching Switching Circuit Phone Call routing G. - - PDF document
Router C Router B Router F Router D
Router E
I1 In
O1 Om
Control information inserted for framing – result: 4x64 > 256!
(frequence sampling = 8kHz)
switch switch time #1 #2 … #8 #1 #2 … #8 frame TDM slot ctrl …
switch switch #1 #2 … #8 IN_A OUT_A OUT_B IN_B #1 #2 … #8 IN_A IN_B #1 #2 … #8 #1 #2 … #8 OUT_A OUT_B
A,1 B,2 A,3 B,4 A,4 A,2 B,1 B,1 B,4 B,3 B,6 A,1 B,7 B,5 IN OUT
Highly parallelized
ion) packetizat (before % 55 . 42 35 . 1 1 1 = + = + =
OFF ON ON
T T T activity
like postal letters! Each must have a specified destination data
either received or lost One single network path
may take different paths (and packets received out of order – need sequence) May lose/corrupt a subset (what happens on the message consistency?)
router router
Tx delay B/C
Router
Tx delay B/C Prop delay
Delay components: Processing delay Transmission delay Queueing delay Propagation delay
Router 1
Router 2
Tx delay M/C
Tx delay M/C Prop delay Tx delay M/C Prop delay Tx delay B/C Prop delay
Router 1
Router 2
Tx delay Mh/C
Prop delay Tx delay Ph/C Tx delay Mh/C
Packet P = 80,000 bytes H = 40 bytes header Ph = 80,040 Message: M=400,000 bytes Mh=M+M/P*H=400,200 bytes Propagation Tp = 0.050 s Del = Mh/C + 3Tp + 2Ph/C = 14.157 s
Prop delay Tx delay Ph/C Prop delay
But if packet size = 40 bytes, Del = 20.154s!
D = 32.76 + 8.19 + 4.10 + 32.77 = 77.83s
D = 0.06 + 33.67 =33.73s
Router 1 Router 3
#1 #2
#3 #4 #1 #2 #3 #4
idle idle idle idle
switch switch #1 #2 … #8 IN_A OUT_A OUT_B IN_B #1 #2 … #8 IN_A IN_B #1 #2 … #8 #1 #2 … #8 OUT_A OUT_B
A,1 B,2 A,3 B,4 A,4 A,2 B,1 B,1 B,4 B,3 B,6 A,1 B,7 B,5 IN OUT
switch switch IN_A OUT_A OUT_B IN_B IN_A IN_B OUT_A OUT_B
21 22 10 14 16 19 33
10 A 14 B 16 B 19 B 21 B 22 B 33 A Label-IN OUT 61 61 12 87 10 32 13 Label-OUT
61 13 61 12 10 32 87
Condition: labels unique @ input Advantage: labels very small!! (ATM technology overhead:
KEY advantage: no reserved phy slots! (asynchronous transfer mode vs synchronous)
queueuing
Queueuing build-up
k N k
−
32.77% 1 40.96% 2 20.48% 3 5.12% 4 0.64% 5 0.03%
k N k C k k N k N C k
− = − + =
1
link capacity
67.23% 1 26.27% 2 5.79% 3 0.67% 4 0.03% 5 0.00%
1 1
N C k k N k N C k k N k
= − + = −
k or C p(k) k*p(k)
loss(C) 32.77% 67.23% 100.00% 1 40.96% 0.4096 26.27% 32.77% 2 20.48% 0.4096 5.79% 6.50% 3 5.12% 0.1536 0.67% 0.70% 4 0.64% 0.0256 0.03% 0.03% 5 0.03% 0.0016 0.00% 0.00%
k or C binom p(k) k * p(k)
loss(C) 1 1,2E-03 0,0E+00 9,99E-01 1,00E+00 1 30 9,3E-03 9,3E-03 9,89E-01 8,34E-01 2 435 3,4E-02 6,7E-02 9,56E-01 6,69E-01 3 4060 7,9E-02 2,4E-01 8,77E-01 5,09E-01 4 27405 1,3E-01 5,3E-01 7,45E-01 3,63E-01 5 142506 1,7E-01 8,6E-01 5,72E-01 2,39E-01 6 593775 1,8E-01 1,1E+00 3,93E-01 1,44E-01 7 2035800 1,5E-01 1,1E+00 2,39E-01 7,81E-02 8 5852925 1,1E-01 8,8E-01 1,29E-01 3,82E-02 9 14307150 6,8E-02 6,1E-01 6,11E-02 1,68E-02 10 30045015 3,5E-02 3,5E-01 2,56E-02 6,57E-03 11 54627300 1,6E-02 1,8E-01 9,49E-03 2,30E-03 12 86493225 6,4E-03 7,7E-02 3,11E-03 7,18E-04 13 119759850 2,2E-03 2,9E-02 9,02E-04 2,00E-04 14 145422675 6,7E-04 9,4E-03 2,31E-04 4,94E-05 15 155117520 1,8E-04 2,7E-03 5,24E-05 1,08E-05 16 145422675 4,2E-05 6,7E-04 1,05E-05 2,11E-06 17 119759850 8,6E-06 1,5E-04 1,84E-06 3,62E-07 18 86493225 1,6E-06 2,8E-05 2,84E-07 5,46E-08 19 54627300 2,5E-07 4,7E-06 3,83E-08 7,21E-09 20 30045015 3,4E-08 6,8E-07 4,48E-09 8,28E-10 21 14307150 4,0E-09 8,5E-08 4,50E-10 8,20E-11 22 5852925 4,1E-10 9,1E-09 3,86E-11 6,92E-12 23 2035800 3,6E-11 8,2E-10 2,78E-12 4,91E-13 24 593775 2,6E-12 6,3E-11 1,65E-13 2,88E-14 25 142506 1,6E-13 3,9E-12 7,82E-15 1,35E-15 26 27405 7,5E-15 2,0E-13 2,87E-16 4,91E-17 27 4060 2,8E-16 7,5E-15 7,60E-18 1,29E-18 28 435 7,5E-18 2,1E-16 1,30E-19 2,18E-20 29 30 1,3E-19 3,7E-18 1,07E-21 1,79E-22 30 1 1,1E-21 3,2E-20 0,00E+00 0,00E+00
1 2 4 3 2
2 1
1 =
5 2
−
1 =
2 =