1 SimFlock: An object oriented model Sampling from the hyper - - PDF document

1
SMART_READER_LITE
LIVE PREVIEW

1 SimFlock: An object oriented model Sampling from the hyper - - PDF document

State of nature concept The hyper distribution : Monte Carlo Simulation II An infinite population of flocks each having its own state of nature defining Advanced Herd Management average growth, mortality, Anders Ringgaard Kristensen laying


slide-1
SLIDE 1

1

Slide 1

Monte Carlo Simulation II

Advanced Herd Management Anders Ringgaard Kristensen

Slide 2

State of nature concept

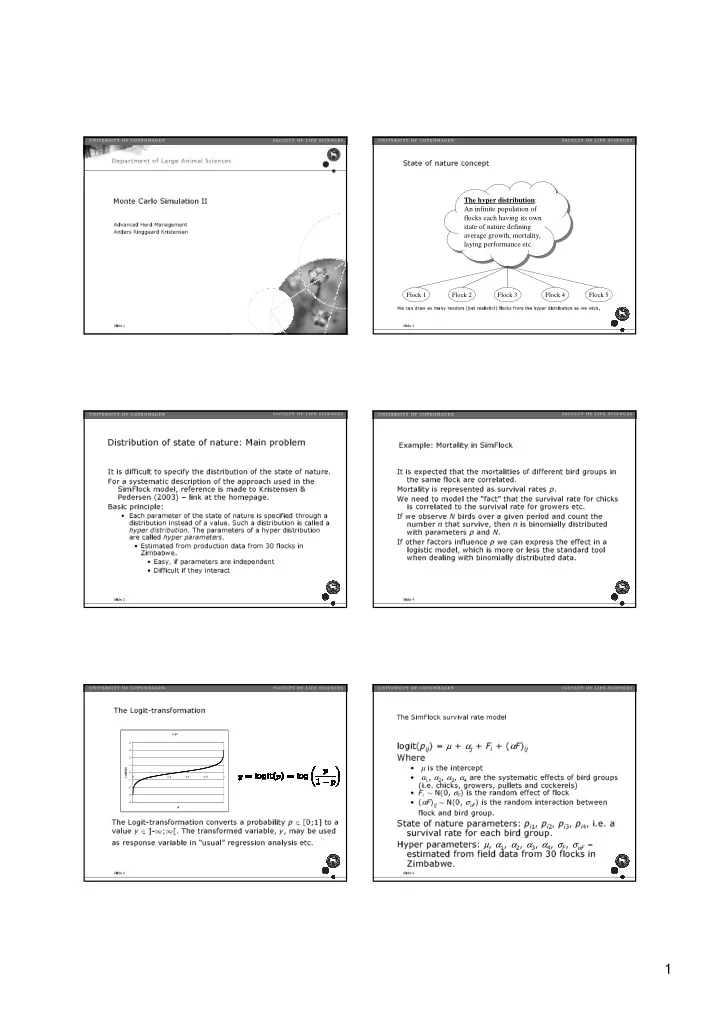
We can draw as many random (but realistic!) flocks from the hyper distribution as we wish.

The hyper distribution: An infinite population of flocks each having its own state of nature defining average growth, mortality, laying performance etc.

Flock 1 Flock 2 Flock 3 Flock 4 Flock 5

Slide 3

Distribution of state of nature: Main problem

It is difficult to specify the distribution of the state of nature. For a systematic description of the approach used in the SimFlock model, reference is made to Kristensen & Pedersen (2003) – link at the homepage. Basic principle:

  • Each parameter of the state of nature is specified through a

distribution instead of a value. Such a distribution is called a hyper distribution. The parameters of a hyper distribution are called hyper parameters.

  • Estimated from production data from 30 flocks in

Zimbabwe.

  • Easy, if parameters are independent
  • Difficult if they interact
Slide 4

Example: Mortality in SimFlock It is expected that the mortalities of different bird groups in the same flock are correlated. Mortality is represented as survival rates p. We need to model the “fact” that the survival rate for chicks is correlated to the survival rate for growers etc. If we observe N birds over a given period and count the number n that survive, then n is binomially distributed with parameters p and N. If other factors influence p we can express the effect in a logistic model, which is more or less the standard tool when dealing with binomially distributed data.

Slide 5

The Logit-transformation

Logit
  • 4
  • 3
  • 2
  • 1
1 2 3 4 0,2 0,4 0,6 0,8 1 p Logit(p)

The Logit-transformation converts a probability p ∈ [0;1] to a value y ∈ ]-∞;∞[. The transformed variable, y, may be used as response variable in “usual” regression analysis etc.

Slide 6

The SimFlock survival rate model

logit(pij) = µ + αj + Fi + (αF)ij Where

  • µ is the intercept
  • α1, α2, α3, α4 are the systematic effects of bird groups

(i.e. chicks, growers, pullets and cockerels)

  • Fi ∼ N(0, σF) is the random effect of flock
  • (αF)ij ∼ N(0, σαF) is the random interaction between

flock and bird group.

State of nature parameters: pi1, pi2, pi3, pi4, i.e. a survival rate for each bird group. Hyper parameters: µ, α1, α2, α3, α4, σF, σαF – estimated from field data from 30 flocks in Zimbabwe.

slide-2
SLIDE 2

2

Slide 7

Sampling from the hyper distribution Draw a random value Fi from N(0, σF

2)

Draw 4 random values (αF)i1, (αF)i2, (αF)i3 and (αF)i4 from N(0, σαF

2)

Calculate the 4 logit values (j = 1, 2, 3, 4)

yij = logit(pij) = µ + αj + Fi + (αF)ij

Transform to 4 survival rates (j = 1, 2, 3, 4) log(pij/(1-pij)) = yij ⇔ pij = 1/(e-yij + 1)

Slide 8

SimFlock: An object oriented model

Breeding animals Hens & Cocks Eggs Chicks Growers Pullets Cockerels Household consumption Market Dead Infertile

Slide 9

User interface – visible objects

All birds and eggs present in the flock shown. States of the birds can be investigated Demo Slide 10

SimFlock: Elements – where are they?

Decision rule Θ State of nature Φ0 Hyper distribution p(Φ0 = φ0) State variables Φs1 … ΦsT Output variables Ω

Slide 11

SimFlock: Decision variables

Built-in decisions (farmer icon):

  • Intended flock size:
  • Hens
  • Cocks
  • Egg removing policy
  • Days from start laying
  • Season
  • Policy for buying breeding birds:
  • Hens
  • Cocks

Other decisions modeled through expected effects (e.g. on mortality).

Slide 12

SimFlock: State of nature parameters In SimFlock, a state of nature is described by 42 parameters:

  • Daily gains of birds, general linear model
  • Survival rates, logistic model
  • Full grown weights, normal distribution
  • Age at puberty, normal distribution
  • Egg fertilization probability, beta distribution
  • Egg hatching probability, logistic model
  • Number of eggs before incubation, normal

dist.

Each time a parameter is defined, a hyper distribution is specified.

slide-3
SLIDE 3

3

Slide 13

SimFlock: Hyper distribution(s) The hyper distribution of the state of nature is specified through 64 hyper parameters. Most of them estimated from the field data collected in 30 flocks. The hyper distribution represents the whole population of flocks under the conditions in question. A state of nature drawn from the hyper distribution represents

  • ne (hypothetical) flock.
  • By drawing e.g. many states of nature we can generate many

realistic hypothetical flocks.

  • Decision rules may have different effects in different flocks.
Slide 14

SimFlock: State variables

The state variables of day i are the states of the individual birds and eggs on that day:

  • Eggs:
  • Fertilized/not fertilized
  • Birds:
  • Age
  • Weight
  • Growth potential
  • Full grown weight
  • Laying capacity
  • Gender
  • Farmer:
  • Needs meat?

There are millions of state variables in a simulation run.

Slide 15

States of a bird

All birds:

  • Unique ID (given at hatching – next integer)
  • Age (updated daily)
  • Weight (updated daily)
  • Gender (drawn at random at hatching)
  • Full grown weight (drawn at random at

hatching)

  • Growth potential (permanent, drawn at

hatching)

Cocks: No further states. For chicks and growers furthermore:

  • Growth state (drawn at hatching/transition)
Slide 16

States of a pullet In addition to the general states:

  • Pullet:
  • Age at first egg, “puberty” (drawn at

transition)

  • Growth state (drawn at transition)
  • Cockerel:
  • Age at “puberty” (drawn at transition)
  • Growth state (drawn at transition)
Slide 17

States of a hen

In addition to the general states:

  • Behavior, not used? (drawn at transition)
  • Laying capacity (drawn at transition)
  • State in cycle (laying, incubating, brooding,

barren) – updated daily.

  • Days since transition in cycle – updated daily
  • Eggs at incubating (drawn at transition in

cycle)

  • Eggs in nest – updated daily.
  • Fertile eggs in nest – updated daily.
Slide 18

SimFlock: Output variables

A total of 40 are defined:

  • Realised gain
  • Realised mortality
  • Eggs removed
  • Chickens produced

Usual technical and economical key figures.

slide-4
SLIDE 4

4

Slide 19

SimFlock: Simulation

The farmer, birds and eggs are represented as objects in the model. Each (simulated) day, the states of all

  • bjects are updated:
  • Age
  • Weight
  • Survival
  • Transition (e.g. egg → chick, chick → grower,

etc)

  • Eggs in nest
Slide 20

Use of the simulation model

System comprehension

  • Answering “what if” questions

General decision support (at population level)

  • The main purpose of SimFlock

Decision support at flock level

  • Not yet possible
Slide 21

System comprehension Usually carried out under one state of nature Answer questions like:

  • If we assume the state of nature parameters are

Φ0 = φ0 what are then the consequences?

  • What if we could improve the survival rate of

chicks?

  • Vary the survival rate systematically – run

simulations and explore the results

  • etc.

Weakness: State of nature parameters are mutually correlated!

Slide 22

General decision support Population level Carried out under multiple states of nature Questions like:

  • Under what circumstances does it pay to change

the decision rule from Θ1 to Θ2?

  • Generate multiple states of nature (random

flocks)

  • Run a simulation job under Θ1
  • Run a simulation job under Θ2
  • Identify the states of nature where it pays
Slide 23

Decision support at flock level

Should “Jens Hansen” change his management from decision rule Θ1 to Θ2? Problems:

  • We don’t know the state of nature for Jens Hansen’s flock.
  • We need to put Jens Hansen’s flock into the model:
  • Not so difficult in SimFlock but very difficult in SimHerd or the Dina

Pig simulation model

Not yet possible in any(?) simulation model.

  • Nevertheless, it has often been done with SimHerd (by ignoring the

problems)

Solution:

  • Combine the simulation model with a Bayesian network
  • Distinguish between true underlying levels and observed consequences
  • Observe the consequences, enter evidence and propagate to obtain a

distribution for the state of nature in this particular flock.

  • If anybody wants to solve this problem within the framework of a

Master’s thesis it would be very much appreciated!

Slide 24

A BN for state of nature in a flock

Hyper distribution. Initially set to the distribution in the population State of nature. Observed in Jens Hansen’s flock. When observed, we can update the rest!

slide-5
SLIDE 5

5

Slide 25

Defining a simulation job in SimFlock

Create an initial flock Specify:

  • Number of states of nature (if more than 1)
  • A question of obtaining a representative sample of flocks

from the abstract population.

  • Number of replications per state of nature
  • How precise do you want the results for each flock to be?
  • Mean values
  • Distribution
  • Number of days to simulate
  • A long simulation period will increase the precision
  • Burn-in days
  • We want to ignore the effect of the initial flock.
Slide 26

Simulation jobs: Considerations Monte Carlo simulation involves huge amounts of numerical calculations. It produces huge amounts of data. Computer capacity may still be a problem

  • Start the simulation at the office Friday afternoon
  • See the results Monday morning
  • Buy the biggest hard disk in the catalogue in
  • rder to store the output
Slide 27

Analyzing the results A herd simulation model produces output of the same kind as real world herds:

  • Must be analyzed according to the same principles

as field data:

  • Calculation of means, standard deviations,

percentiles etc.

  • Graphical plots
  • Variance and regression analysis, but
  • Be careful with the usual significance

concept

Slide 28

Result example 100 states of nature, 50 replications per s.o.n.

  • Chickens produced in 3 years
20 40 60 80 100 120 20 40 60 80 100 State of nature Chickens produced in 3 years

Same level – different risk

Slide 29

The significance concept

In simulated data, we know that the tested policies (or parameter sets) are different:

  • If we simulated with
  • Enough replications
  • Sufficiently long periods
  • - then all differences are significant.

Estimate the size of the difference with any desired precision. Limited resources may “persuade” us to use significance tests …

Slide 30

Results in SimFlock Shown in tables Exported to files for analysis with other tools:

  • Excel
  • R
  • SAS

The exercises

slide-6
SLIDE 6

6

Slide 31

When do we use (MC) simulation When other methods fail

  • Evaluation of decision strategies
  • Consequences of deviating production results
  • Consequences of implementing research results in

practice.

A good answer to the (almost) mandatory question at exam:

  • Could you have used an other method to analyze

the problem you have worked with?

  • (Question 2: How would you do it)
Slide 32

Search for optimum In general simulation models are used for evaluation of pre-defined strategies. No optimization is carried out – the user must come up with “the good ideas” Methods to perform search for optimum exist – refer to the textbook notes.

  • Extremely demanding from a computational point
  • f view.