
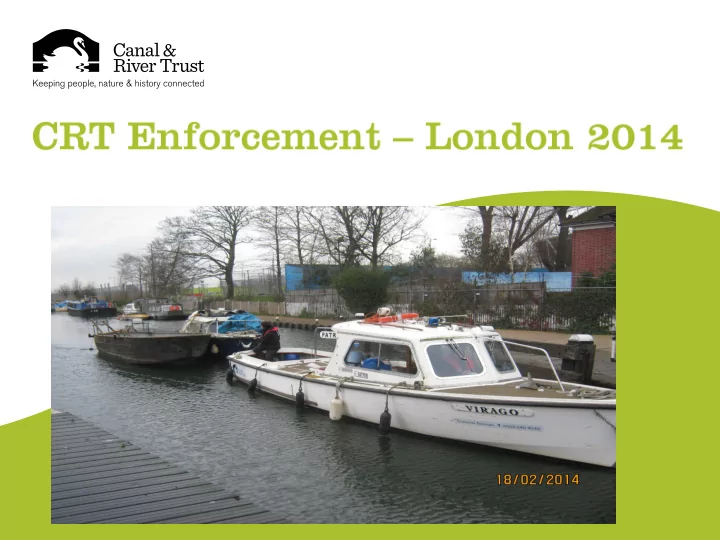
SLIDE 1
1. Enforcement Figures 2. Boat Numbers 3. Enforcement Cases 4. - - PowerPoint PPT Presentation
1. Enforcement Figures 2. Boat Numbers 3. Enforcement Cases 4. Enforcement Team 5. General Aims Simon London Evasion Stats vs Boat Numbers 14 3500 12 3000 10 2500 No of Boats Evasion % 8 2000 6 1500 4 1000 2 500 0 0 2007
500 1000 1500 2000 2500 3000 3500 2 4 6 8 10 12 14 2007 2008 2009 2010 2011 2012 2013 2014 No of Boats Evasion %
London % National % No of bts
CC boats in London areas West Central East Total Mar-12 129 232 277 638 Mar-13 149 350 270 769 Oct 13~ 218 371 452 1041 Mar 14# 215 351 486 1052
~ interim check
100 200 300 400 500 600 Mar-12 Mar-13 Oct 13~ Mar 14#
West Central East