
SLIDE 1
1
1
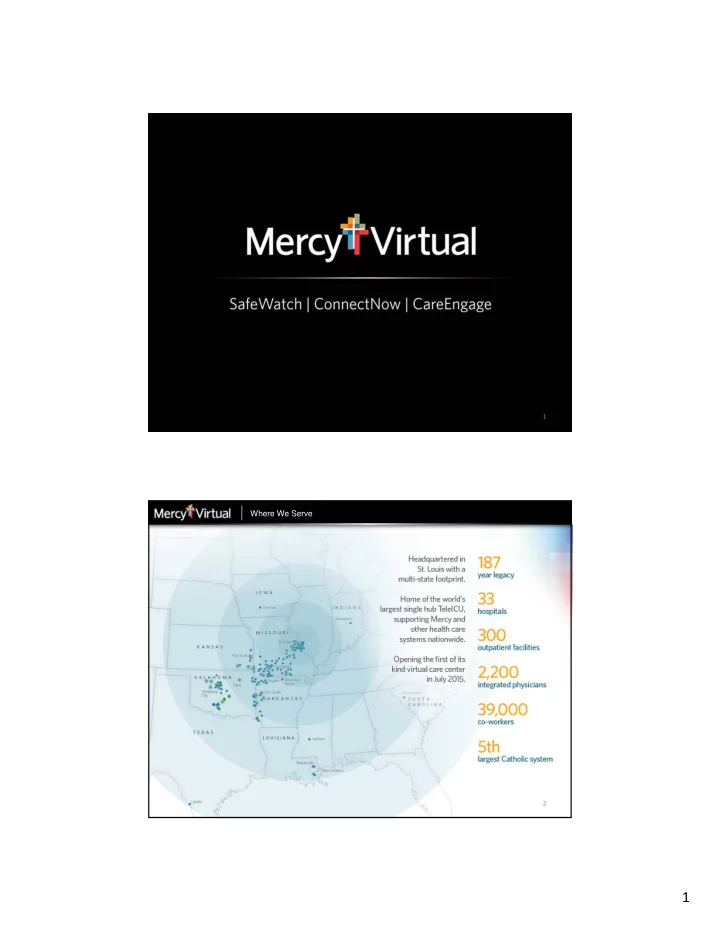
Where We Serve
2
1 Do we feed the Beast or Grow the Village ? Statement of intent - - PDF document
1 Where We Serve 2 1 Do we feed the Beast or Grow the Village ? Statement of intent Proactively shape our future Integrate/partner with physician Invest in information technology and tele health Care without borders
1
Where We Serve
2
– Proactively shape our future – Integrate/partner with physician – Invest in information technology and tele‐health
– Utilize technology to remove cultural barriers and geographic boundaries to care delivery
– Medical home concepts utilizing team care and extensions of primary care models – Utilize technology to eliminate the disparity of medical care delivery – Use data for descriptive, prescriptive and predictive analytics
– Centralized disease management – Care on demand – 24/7 – Delivery at multiple venues
– Bring physicians and nurses into non traditional administrative and partnering roles – Look outside health care for innovative leadership and change 3
we need to support primary care so the model can change
– Centered around urban medical centers
4
7
SafeWatch | ConnectNow | CareEngage
9
SafeWatch | onnectNow | HealthWell SafeWatch | ConnectNow | CareEngage
10
SafeWath | ConnectNow | HealthWell SafeWatch | ConnectNow | CareEngage
11
SafeWatc | ConnectNow | HealthWell
2 4 6 8 10 12 14 16 18 20 10 20 30 40 50 60 70 80 90 100 Percent Cases
Ventilator Associated Pneumonia (VAP) Cases and VAP Bundle Compliance
SafeWatch | ConnectNow | CareEngage
12
SafeWatch | ConnectNow | CareEngag
2 4 6 8 10 12 14 16 18 Number of Infections
Central Line Blood Stream Infections All Nursing Units, All Mercy Communities March 2010 to March 2012
While we have yet to achieve
we are performing 26% better than the national benchmark
2 4 6 8 10 12 14 16 18
ICU CLABSI
ICU CLABSI Linear (ICU CLABSI)
eICU monitors central line insertions per the hospital’s request
SafeWatch | ConnectNow |HealthWell
2009 2010 2011 2012 2013
0.00 0.20 0.40 0.60 0.80 1.00 1.20 1.40 1.60
Hospital Mortality
APACHE Predicted
Actual/Predicted Mortality
2009 2010 2011 2012 2013
0.00 0.20 0.40 0.60 0.80 1.00 1.20 1.40 1.60 Hospital Length of Stay
APACHE Predicted
Actual/Predicted LOS
Mortality rates
25% below expected 20% reduction in LOS
saving $900/ICU day
SafeWatch | ConnectNow | CareEngage
14
SafeWatch | onnectNow | HealthWell
SafeWatch | ConnectNow | CareEngage
15 BEFORE SEPSIS PROGRAM Diagnosis Cases Mortality Deaths Direct Cost per Case ($) Severe Sepsis 118 28.00% 33 Septic Shock 124 46.50% 58 Total 242 37.60% 91 $12,009 AFTER SEPSIS PROGRAM Diagnosis Cases Mortality Deaths Direct Cost per Case ($) Severe Sepsis 179 14.50% 26 Septic Shock 173 18.50% 32 Total 352 16.50% 58 $9,252
Patient Data
Information Software Driven Triage Virtual Units
Central
Monitoring Technology Driven Decision Support Actionable Alerts
Workflow Re‐engineering Intervention with Improved Outcomes Decreased cost
Point of care
EMR E‐ICU Home Monitoring Physician Exam in person or remotely Interviews etc. Process Innovation & Action taken
Virtual Units The Power of Central Monitoring And Process Reengineering
Facility – ICU, Acute Care Ambulatory Home
EWIS SafeWatch
SafeWatch | ConnectNow | CareEngage
18
SafeWatch | ConnectNow | CareEngage
SafeWatch | ConnectNow | CareEngage 20
SafeWatch | ConnectNow | CareEngage
Facility Annual ED Volume 2013 Epic Go-live date 2010* 2011* 2012 2013**
Teleneurology Consults 2013
(>1350 visits)
Hot Springs 31,000 Sep-10 2 6 21 20 20 Springfield 51,000 Jan-09 n/a 21 41 48 20 Lebanon 20,000 May-11 n/a 1 4 6 7 Rogers 22,000 Mar-08 1 4 13 23 28 Fort Smith 38,000 Sep-10 2 18 8 13 Washington 25,000 Jul-09 1 7 9 12
*Partial Year **Partial Year – Data complete through October 2013 discharges Source: Epic Electronic Health Record Charge and Medication Administrations Record data
SafeWatch | ConnectNow | CareEngage 22
SafeWatch | ConnectNow | CareEngage 23
118 81 104 72 84 101 143 197 248 316 363 485
100 200 300 400 500 Jan Feb Mar Apr May Jun July Aug Sept Oct Nov Dec
eVisits per Month
100000 200000 300000 400000 500000 600000 Jan-13 Feb-13 Mar-13 Apr-13 May-13 Jun-13 Jul-13 Aug-13 Sep-13 Oct-13 Nov-13 Dec-13 *Increase since last quarter
Engagement with MyMercy
1,726,131
7.4%
538,050
4.87%
5:43
VISITS VISITS
FY2014, Q2, Oct – Dec, 2013
Total MyMercy Account Registrations 512,136
10,000 Patient Pop.
20% of population 80% of the $’s 5% spend 45% of the $’s 15% spend 35% of the $’s 80% are reasonably well Intensive outpatient Virtual Care
Internist
Advanced Practitioner Advanced Practitioner RN RN CM CM
EHR data – prescriptive analytics Home monitoring on all Virtual Units Virtual Rounding on all PHR Smart Phone Apps EHR data – predictive analytics Selective Home monitoring Virtual Units Virtual Rounding ‐ selective PHR Smart Phone Apps EHR data Wellness Virtual Unit PHR Smart Phone Apps
Impact Cost $ 1,700,000 ‐‐ $ 14.17 pmpm Rev $13,174,800 ‐‐ $109.79 pmpm Forming Virtual Ambulatory Units
40,000 Patient Pop. 240,000 Patient Pop.
Physician Group 95% of the Med Staff
“Washington” Mo.
20,000 population 112,000 service area 35% Medicare/Medicaid 65% commercial Services which will be provided by Mercy Virtual E – Acute IACU ED Support – telepsych. Specialty follow‐up and availability Pediatrics Telestroke Telesepsis Home Monitoring NOC 24/7 Extensions of PCP Community Centers
Patient’s Home
Patient Portal with smart Apps 2 net monitoring
Virtual Care support
Post Acute Care Community Hospitalists Home Health SNF Noah’s Ark 150 Bed Hospital 26
Virtual Care Center
28
Virtual Care Center
29
Virtual Care Center
30
31 32