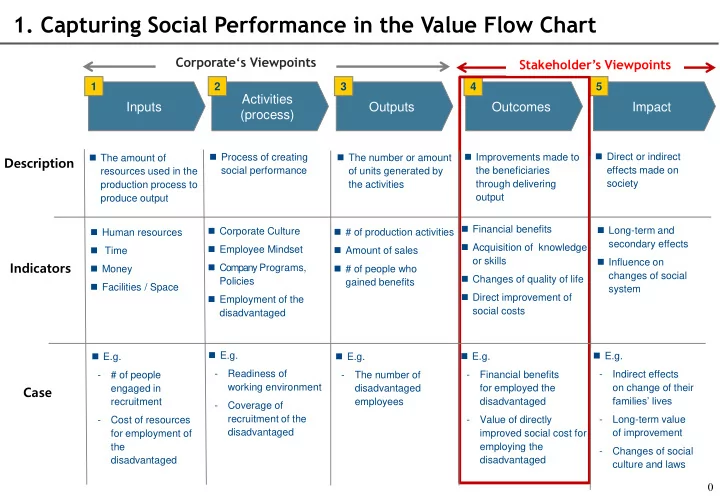
1. Capturing Social Performance in the Value Flow Chart Stakeholders - - PowerPoint PPT Presentation

1 capturing social performance in the value flow chart
SMART_READER_LITE
LIVE PREVIEW

1. Capturing Social Performance in the Value Flow Chart Stakeholders - - PowerPoint PPT Presentation

1. Capturing Social Performance in the Value Flow Chart Stakeholders Viewpoints 1 2 3 4 5 Activities Inputs Outputs Outcomes Impact (process) Process of creating Improvements made to Direct or indirect The amount of


slide-1
SLIDE 1

Inputs

1

Activities (process)

2

Outputs

3

Outcomes

4

Impact

5

Description Indicators

 The amount of resources used in the production process to produce output  Human resources  Time  Money  Facilities / Space  Process of creating social performance  The number or amount

  • f units generated by

the activities  Improvements made to the beneficiaries through delivering

  • utput

 Direct or indirect effects made on society  Corporate Culture  Employee Mindset  Company Programs, Policies  Employment of the disadvantaged  # of production activities  Amount of sales  # of people who gained benefits  Financial benefits  Acquisition of knowledge

  • r skills

 Changes of quality of life  Direct improvement of social costs  Long-term and secondary effects  Influence on changes of social system

  • 1. Capturing Social Performance in the Value Flow Chart

Case

 E.g.

  • # of people

engaged in recruitment

  • Cost of resources

for employment of the disadvantaged  E.g.

  • Readiness of

working environment

  • Coverage of

recruitment of the disadvantaged  E.g.

  • The number of

disadvantaged employees  E.g.

  • Financial benefits

for employed the disadvantaged

  • Value of directly

improved social cost for employing the disadvantaged

Stakeholder’s Viewpoints

 E.g.

  • Indirect effects
  • n change of their

families’ lives

  • Long-term value
  • f improvement
  • Changes of social

culture and laws

slide-2
SLIDE 2

Labor Jobs created for the disadvantaged Diversity and inclusion in corporate policies Energy consumption Material consumption

Environment (E) Social (S) Governance (G)

Shareholder protection Prevention of Corruption Safety and Health Management

Alleviation of inequality (poverty, gender, age, etc.)

Fairness of contract execution Supportand cooperation

SHE practice for suppliers

Philanthropic Purchase

Purchase of global fair-trading

Quality of life

Prevention of aberrant behavior (crime, substance abuse, etc.)

Process Product Value chain

Water consumption GHG emissions

Boosts in public interest (education, culture, community, etc.)

Community

Social Contribution Philanthropic projects Employee Volunteering & Donations Community protections for safety and health Violation of laws Reduction of resource consumption Reduction of environmental pollution Air Pollutant Emissions Water pollutant emission Waste disposal

Stability of social institutions (family, health, safety, etc.)

Mutual growth consumer protection safety quality Information Accounting transparency

1

  • 2. Measurement Indicators of SK DBL Social Performance
slide-3
SLIDE 3

Deduction of Compensation Is it related to Social Problem? Define Outcomes (Benefits & Costs)

Y

  • Classify types of performances (Benefits and Costs)
  • Internal : Consumer

e.g. Vaccine case - Reduction of incidence rate

  • External : the 3rd Party

e.g. Vaccine case - Decrease in contagion rate

Calculation of Total Performance

N

  • General Consumer Surplus
  • General Supplier Surplus

Consideration Of Contribution Define Indicators

  • Applying rules of allocation
  • Value-added based
  • Input resources based
  • Negotiation based
  • Shapley Value…
  • Market Compensation
  • Subsidies

Economic welfare

1 2 3 4 5 6

  • Direct intrinsic valuation
  • Comparative pricing
  • Legal Context

& Policies

  • UN SDGs
  • Local Social

Consensus (with evidence)

  • Functions, Variables, Data
  • 3. Work Flows of Measuring Social Performances (SK DBL)