
SLIDE 1
1
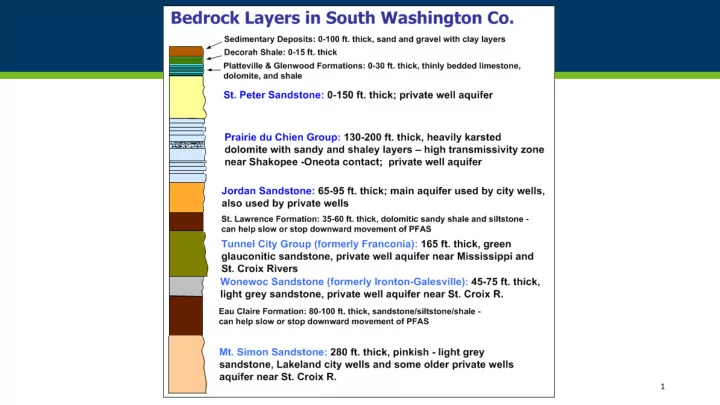
1 Bedrock Geology of South Washington Co. B I-94 B A A - - PowerPoint PPT Presentation
1 Bedrock Geology of South Washington Co. B I-94 B A A Washington County Geologic Atlas, Plate 2 (Steenberg & Retzler, 2016) 2 Groundwater Flow in South Washington County A groundwater divide extends from north to south
1
2
Washington County Geologic Atlas, Plate 2 (Steenberg & Retzler, 2016)
I-94
A A’ B B’
3
4
5
6
7
8
9