1 2 HELPS PRIORITIZE PLANNING TOOL RESOURCES Overall need - - PDF document

1 2
SMART_READER_LITE
LIVE PREVIEW

1 2 HELPS PRIORITIZE PLANNING TOOL RESOURCES Overall need - - PDF document

2000 03 2017 07 11 14 1 WHAT IS NEIGHBORHOOD HEALTH? 1 2 HELPS PRIORITIZE PLANNING TOOL RESOURCES Overall need Shows where to target metric resources Residential-based Triage for primarily neighborhoods


slide-1
SLIDE 1

1 2000 2017

1

03 07 11 14

WHAT IS NEIGHBORHOOD HEALTH?

1 2

PLANNING TOOL HELPS PRIORITIZE RESOURCES

  • Overall “need”

metric

  • Residential-based

primarily

  • Shows where to target

resources

  • Triage for

neighborhoods

2

slide-2
SLIDE 2

2

HEALTH = 5 VITAL SIGNS

POVERTY CRIMES RESIDENTIAL PROPERTY VALUES HOME OWNERSHIP UNSAFE STRUCTURES NOTE: Influenced by larger market trends

3

average

HEALTHY OUT PATIENT AT RISK INTENSIVE CARE

  • ptimal

favorable emerging negative seriously distressed Vital signs

4

slide-3
SLIDE 3

3

WHAT CHANGED FOR 2017?

5

NEIGHBORHOOD HEALTH 2014-2017

117 block groups 5 block groups 1 block group fell into Intensive Care fell into At Risk 18 block groups Better Health Rating

6

slide-4
SLIDE 4

4

CITY-WIDE HEALTH TRENDING UP

Census block groups

Intensive Care/At Risk cut from 33% to 28% Healthy/OP improved from 67% to 72%

2014 2017

2000

7

NIA HEALTH TRENDING UP

Census block groups

Intensive Care/At Risk cut from 68% to 64% Healthy/OP improved from 32% to 36%

2014 2017

2000

8

slide-5
SLIDE 5

5

NIA HEALTH TRENDING UP

Number of Census block groups

Intensive Care/At Risk cut from 77% to 64% Healthy/OP improved from 23% to 36%

2000 2017

2014

9

WHERE?

10

slide-6
SLIDE 6

6

82% 11

WHY?

12

slide-7
SLIDE 7

7

2014-2017

NIA block groups

POVERTY PUBLIC SAFETY PROPERTY VALUES SF HOME OWNERSHIP UNSAFE STRUCTURES

+16 +8 +11 +10

  • 9
  • 4
  • 1
  • 25

+7 13

LARGER TRENDS

ECONOMY

Fewer people in poverty; improved job market

HOUSING MARKET

“For-sale” inventory very low; values appreciating; new lot absorption

PROPERTY MAINTENANCE

Less blighted and vacant structures; improves property values and homeownership rates

14

slide-8
SLIDE 8

8

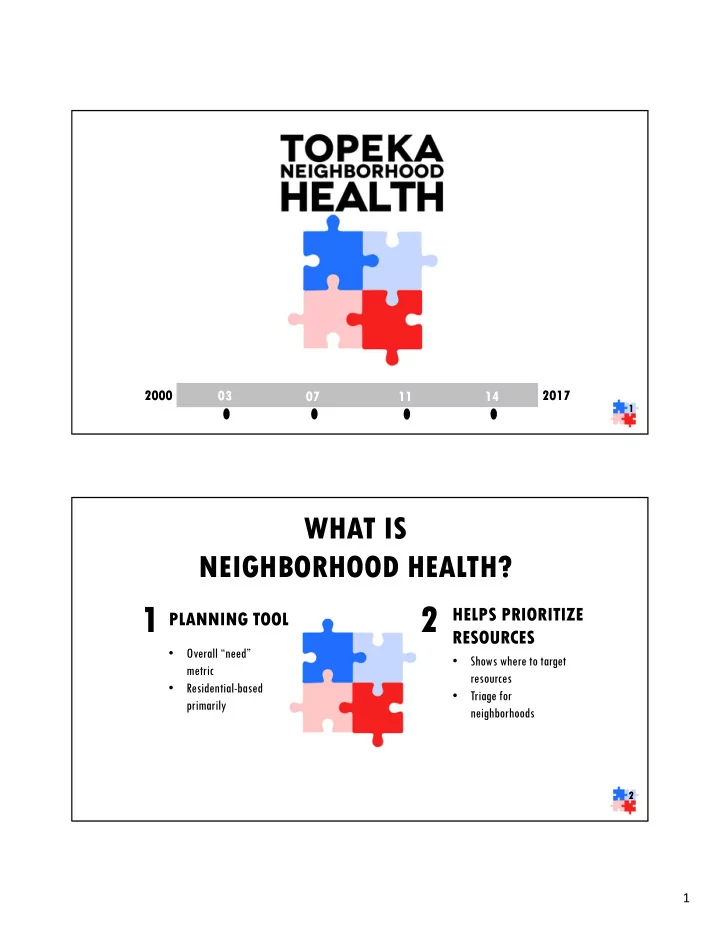
HOW WILL FINDINGS BE USED?

  • Help public understand trends/data
  • Open access to data online
  • Meet with most impacted neighborhoods
  • Assess/adjust incentives and services
  • NRP tax rebates
  • SORT
  • Property Maintenance
  • Neighborhood Partnerships (e.g. NET Reach)
  • Pedestrian Master Plan
  • Other

7

15

SUMMARY

HEALTHY BUMP FOR MOST

More areas improved than not since 2014; East Topeka out of IC

ECONOMY MATTERS

Post-recession effects stabilized; property values and incomes positively impacted

PROPERTY MAINTENANCE MATTERS

Ramped-up anti-blight initiatives will help overall ratings even as more properties are cited

LONG-TERM NIA HEALTH TRENDING UP

IC block groups cut in half and OP blocks groups nearly double since 2000

16

slide-9
SLIDE 9

9

7

More Information & Interactive Map www.topeka.org/planning/neighborhood-health

17