07-10-2014 Detecting oestrus by monitoring sows visits to a boar - - PDF document

07 10 2014
SMART_READER_LITE
LIVE PREVIEW

07-10-2014 Detecting oestrus by monitoring sows visits to a boar - - PDF document

07-10-2014 Detecting oestrus by monitoring sows visits to a boar T. Ostersen, C. Cornou, A.R. Kristensen, 2010 Presented by Dan Jensen Introduction Problem: 1. Not all inseminations are successful (5 25 %) 2. More group housing of


slide-1
SLIDE 1

07-10-2014 1

Detecting oestrus by monitoring sows’ visits to a boar

  • T. Ostersen, C. Cornou, A.R. Kristensen, 2010

Presented by Dan Jensen

Introduction

  • Problem:
  • 1. Not all inseminations are successful

(5 – 25 %)

  • 2. More group housing of pregnant

sows – since 2003

  • Goal: Automatic oestrus detection
  • Time/money saver!
  • Modern standard: Manually applied

pressure-test

  • Literature says: visit to boar

Advanced Quantitative Methods in Herd Management – 25/09 2013 Dias 2
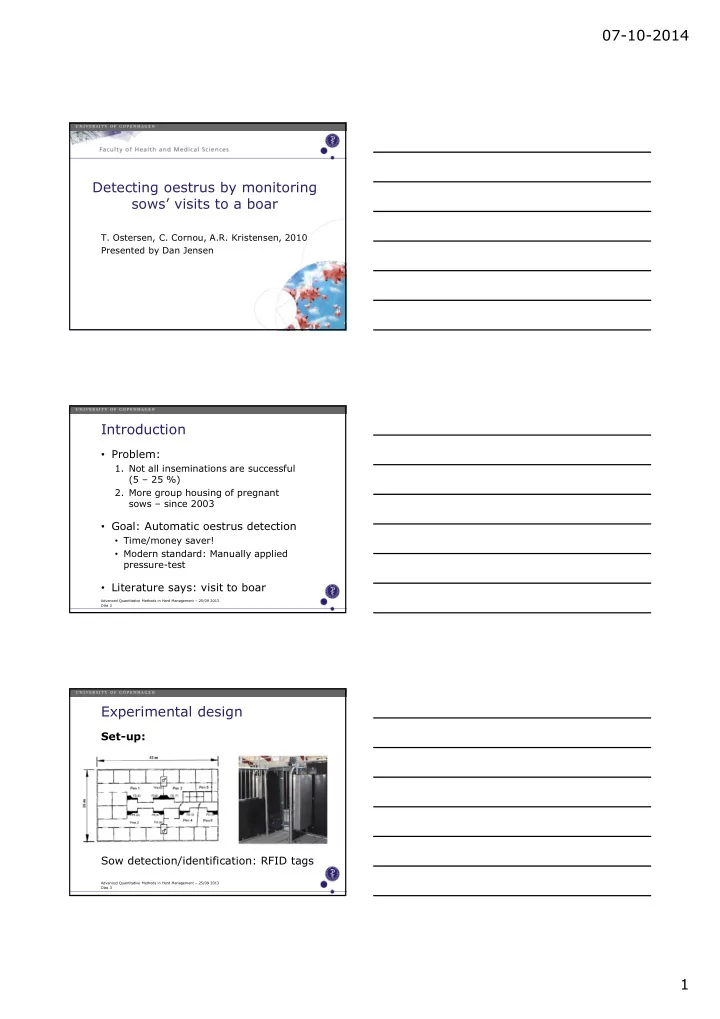
Experimental design

Set-up: Sow detection/identification: RFID tags

Advanced Quantitative Methods in Herd Management – 25/09 2013 Dias 3

slide-2
SLIDE 2

07-10-2014 2

Experimental design

Learning data:

  • 41 sows in controlled environments,

all in post-weaning oestrus:

  • 1. 5 sows, 2005
  • 2. 12 sows, 2007
  • 3. 24 sows, 2008
  • 17 were inseminated, 24 were not
  • Back pressure test 3 times/day
  • Continuous measure of boar visits

Advanced Quantitative Methods in Herd Management – 25/09 2013 Dias 4

Experimental design

Test data:

  • Collected: October 2004 – June 2009
  • 3886 test periods (>= 14 days)
  • 111 cases of gestation oestrus

Advanced Quantitative Methods in Herd Management – 25/09 2013 Dias 5

Quick data structure overview

From this, models must account for:

1. Individual patterns 2. Outliers 3. Diurnal effect

Advanced Quantitative Methods in Herd Management – 25/09 2013 Dias 6

slide-3
SLIDE 3

07-10-2014 3

Indicator 1: Visit duration

Dynamic linear model (DLM): Yt = log(seconds/visit) Error terms, vt and wt , are considered independant and normally distributed

Advanced Quantitative Methods in Herd Management – 25/09 2013 Dias 7

Observation equation System equation

Indicator 1: Visit duration

Advanced Quantitative Methods in Herd Management – 25/09 2013 Dias 8

Four states – four sets of DLM: State change determined by:

  • Observation
  • Markov Prior

probability

  • Multi process, class 2

Normal model estimated for each sow

Indicator 1: Visit duration

Advanced Quantitative Methods in Herd Management – 25/09 2013 Dias 9

Factors optimized in Learning data: Method:

  • Prior probabilities ( )
  • Time threshold (∆)
  • Prior point estimate
  • f variance (S0)
  • Maximize oestrus SE and SP

per 24 hours (-72 h to +48 h)

  • Alarm if p(Oestrus) > 0.8
slide-4
SLIDE 4

07-10-2014 4

Indicator 1: Visit duration

Advanced Quantitative Methods in Herd Management – 25/09 2013 Dias 10

Optimization results

Per day! SE = 0.96 per pig!

5 minute break

Advanced Quantitative Methods in Herd Management – 25/09 2013 Dias 11

Indicator 2: Visit frequency

Advanced Quantitative Methods in Herd Management – 25/09 2013 Dias 12

High Low Low

slide-5
SLIDE 5

07-10-2014 5

Indicator 2: Visit frequency

Advanced Quantitative Methods in Herd Management – 25/09 2013 Dias 13

Data is Poisson distributed:

  • Dynamic Generalised Linear Model!

Yt = Nvisits / 6 hrs W = system variance

Probability function Compromise – variability vs. responstime

Indicator 2: Visit frequency

Advanced Quantitative Methods in Herd Management – 25/09 2013 Dias 14

Parameter estimation, using learning data: Method: Minimize squared forecast errors during normal conditions Result:

Indicator 2: Visit frequency

Advanced Quantitative Methods in Herd Management – 25/09 2013 Dias 15

The point: we can make a forecast!

Optimized limit: OI > 3.3

slide-6
SLIDE 6

07-10-2014 6

A combined model

Advanced Quantitative Methods in Herd Management – 25/09 2013 Dias 16

The two models are combined using Bayes theorem:

P(oestrus) = result of duration model P(+|oestrus) = sensitivity of duration model P(-|oestrus) = 1-sensitivity of duration model Threshold: 0.95

Results

Advanced Quantitative Methods in Herd Management – 25/09 2013 Dias 17

(LR = Likelihood Ratio)

Conclusions, 1

Advanced Quantitative Methods in Herd Management – 25/09 2013 Dias 18

Best detection model: Model is good (better) for:

  • 1. Duration by the boar
  • 1. Oestrus detection in gestation station!
slide-7
SLIDE 7

07-10-2014 7

Conclusions, 2

Advanced Quantitative Methods in Herd Management – 25/09 2013 Dias 19

Advances over others: Shortcomings(?): Improvement perspectives:

  • 1. Better specificity
  • 2. Better response time (1 – 6 hours vs. 1 day)
  • 1. Lower sensitivity

(e.g. 93 % by Bressers et al.)

  • 1. Include more information:
  • 1. Feeding rank
  • 2. Activity
  • 3. Pregnancy test