SLIDE 1
Yes on 2C: A Smart Deal for Denver Post-Election Report
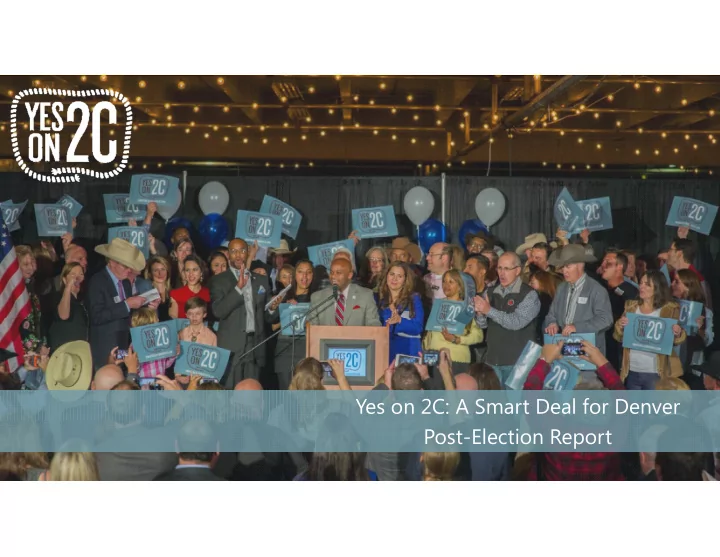
SLIDE 2 A Proven Path to Victory
2
SLIDE 3
How we won: Engaging Television Ads
+ Three television ads ran from Sept 28th through Election Day + Average viewer saw 2C ads 33 times over six weeks
3
SLIDE 4
How we won: Targeted Digital Communications
+ Produced three 30s-60s online videos in-house + Used e-mail and social media to create a voice for “Larimer the Longhorn” + Created model scores by issue to target the right voters with the right message
4
SLIDE 5 How we won: Early Outreach to Secure Support
+ Secured endorsements from 632 prominent individuals and
+ Attended 112 neighborhood meetings and visibility events + Knocked on 62,103 doors and made 33,034 phone calls
5
NWSS Young Guns Event Mayor Webb and John Zapien
SLIDE 6 Key Findings from Election Day
6
SLIDE 7 Key Findings: 2C Gained 20% Since Initial Polling
Yes No Undecided April 45% 42% 12% July 60% 34% 6% September 60% 35% 5% October 65% 27% 8% Election Results 65.5% 34.5%
- + Support improved by 20%
+ Improved ballot language in June focused on listing improvements to the site + Sustained TV advertising secured
- ur victory and brought another
5% in support of 2C
7
SLIDE 8
Key Findings: 2C was popular throughout Denver
+ Measure 2C passed in all 346 precincts in Denver + Strongest support was in Council Districts 9 (72%, Brooks) and 8 (70%, Herndon) + Earned at least 60% support in each City Council district
8
SLIDE 9
Key Findings: Local neighborhoods are invested in 2C
+ Council District 9 had the highest support for 2C where 72.3% voted to approve + Turnout was consistent with 2011 – roughly 26% – suggesting more work needs to be done to engage residents around the project
9
SLIDE 10
Key Findings: 2C was popular with all parties
+ 2C overcame partisan politics to perform well in Democratic and Republican precincts + Other measures relied more heavily on Democratic voters, and suffered with Republicans
10
SLIDE 11 Key Findings: 14% Increase in Turnout
11
+ 124,883 people voted in the November 2015 Election + An increase of 15,136 votes, or 14%, from November 2011 + Turnout in Globeville, Elyria and Swansea was consistent with 2011
SLIDE 12 Key Findings: Voters are younger and more Unaffiliated
+ Voters were 3.6% more Unaffiliated than in 2011 + 18-49 year olds made up 40.3% of the vote in 2015, increase of 4.6%
12
2015 2011 Difference Democrats 54.6% 56.2%
Unaffiliated 26.3% 22.7% 3.6% Republicans 17.9% 20.2%
2015 2011 Difference 18-49 40.3% 35.7% 4.6% 50+ 59.7% 64.3%
SLIDE 13
Key Findings: Voters are returning ballots later
+ 36% of voters waited until Election Day to return their ballot, compared with 30% in 2011. + The wait to return ballots is driven by a growing younger population – 57% of 18-49 year olds voted in the final two days, compared to just 29% of voters older than 65.
13