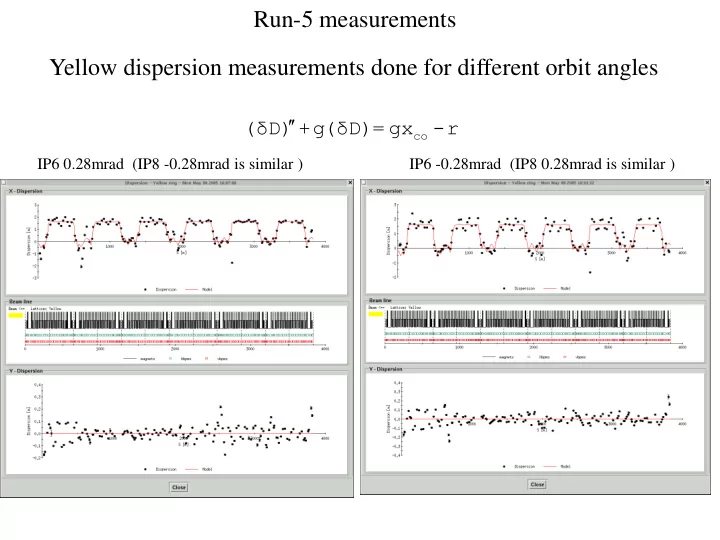
SLIDE 1 Yellow dispersion measurements done for different orbit angles
IP6 0.28mrad (IP8 -0.28mrad is similar ) IP6 -0.28mrad (IP8 0.28mrad is similar )
co
(δD) +g(δD)= gx
Run-5 measurements
SLIDE 2 0.mrad
0.mrad 0.28mrad
Yellow beam decays from orbit angle in IP6 Run-5 measurements
SLIDE 3
Yellow dispersion (Au103), design and measured
SLIDE 4
IR12 dipole correctors reproduce well the horizontal dispersion error wave
SLIDE 5
Tried local orbit changes in IR12
SLIDE 6
Observed reduction of the dispersion in IR6 and IR8 ~20%. Not good enough.
SLIDE 7
Beam decay symmetry changes during IR12 orbit scan
SLIDE 8
Horizontal dispersion locally corrected using IR6 and IR8 0.1mrad angle bumps
SLIDE 9
Example of IR6 vertical orbit bump scan for local decoupling
SLIDE 10 Summary of dispersion and skew quadrupole studies:
- Horizontal and vertical dispersion in IR6 and IR8 can be effectively corrected with
small orbit angle bumps in those regions. But it did not provided obvious improvement in the momentum aperture.
- - The attempt to correct the dispersion at the suspected error sources (IR12 and IR4)
was not effective, since quite large orbit distortion or skew quadrupole changes needed to compensate for the dispersion error completely.
- - The orbit bump data for IR6 and IR8 region in Yellow have been collected to
calculate the required local skew quadrupole adjustments in those regions. Local coupling in IR6 looked noticable worse than that in IR8.
SLIDE 11
X dispersion error fitted with orbit at arc2 IR12 Difference of the (blue and brown curves)
SLIDE 12
X dispersion error fitted with orbit at arc12
SLIDE 13 Blue/Yellow
IR6 H IR6 V IR8 H IR8 V b*,m 0.76/0.72 0.69/0.84 0.65/0.71 0.63/0.84 s*,m 0.3/0.13
0.06/-0.33
Updates results from the gradient variation measurements
Beam Experiment. January 6, 2010
Accuracy: dQ = 0.0001 -> ds* = 16 cm, db*~0.01