
SLIDE 1
FAC PRESENTATION MAY 15, 2019 5/13/2019 1
Columbus City Schools MONTHLY FINANCIAL REPORT
For the month ending April 30, 2019
FINANCE AND APPROPRIATIONS COMMITTEE REVIEW May 15, 2019 PRESENTED TO THE BOARD OF EDUCATION May 21, 2019
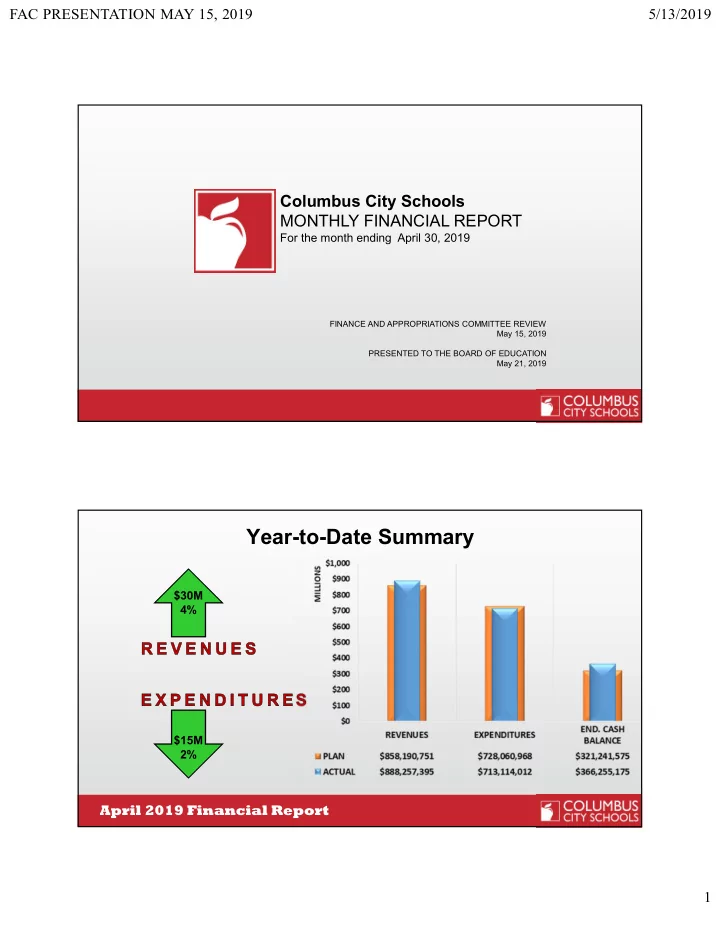
Year-to-Date Summary
$30M 4% $15M 2%