
SLIDE 1
1/19
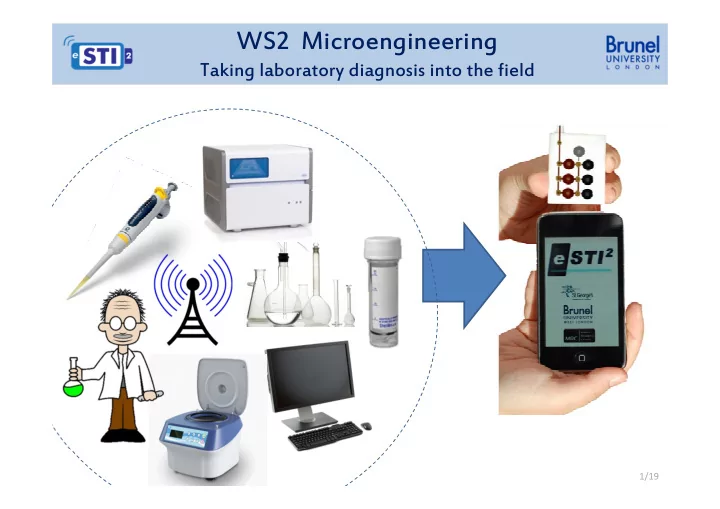
WS2 Microengineering Taking laboratory diagnosis into the field - - PowerPoint PPT Presentation
WS2 Microengineering Taking laboratory diagnosis into the field 1/19 The team Professor Wamadeva Balachandran (Bala) Principal Investigator Dr Krishna Burugapalli Professor Rob Evans Professor Chris Hudson Dr Predraig Slijpevic Dr Jeremy
1/19
2/19
Professor Wamadeva Balachandran (Bala) Principal Investigator
Dr Jeremy Ahern Microfabrication Dr Nada Manivannan Multiphysics Modelling Professor Chris Hudson Electronic Engineering Professor Rob Evans Biosciences Dr Predraig Slijpevic Biosciences Pascal Craw PhD Student Biomedical Engineering Branavan Nehru PhD Student Paper microfluidics Dr Yanmeng Xu Printed Electronics Sara Chaychian PhD Student Electrical Engineering Tosan Ereku PhD Student Engineering Design Dr Krishna Burugapalli Biomedical Engineering Shavini Wijesuriya PhD Student Engineering Design Sana Hussain Visiting Scholar Biosciences Sivanesan Tulasidas PhD Student Wireless Communication Dr Ruth Mackay BioMEMS/NEMS
3/19
4/19
Wireless Interface
DNA Extraction & Purification
Sample collection
MicroFluidic Network DNA Detection Electronic Control System
DNA Amplification Sample concentration & cell lysis
5/19
Electromagnets
Lysis Amplification Detection Sample & Reagents Waste
GPS RFID Bluetooth
3G Mobile
USB WiFi
Microcontroller Power Management
Display and User Interface
Magnetic Electrochemical Optical
SPR
MEMS Nanowire
Nucleic Acid Detector Pumps Valve actuators Thermal control
Standardisation Concentration / Purification
Control System Communication
Valves Sensors Electromagnets
Microfluidic Network
Pathways
6/19
Urine collection devices
7/19
Streamline depiction of flow from inlets to device discharge orifice Cessational flow of urine from six inlets into the air-filled cavity
8/19
Deformable silicone reservoirs Cam actuated pump filling microfluidic chip 25uL microfluidic chip
9/19
Two DNA extraction devices with embedded biopolymer membrane
10/19
10 20 30 40 50 60 70 80 90 100 0.1 100
Percentage Recovery (%) Sample Concentration (ng/uL)
Spin Column (Qiagen) Bioplymer membrane
11/19
1 2 3 4 5 6 7 8 9 10
25µL tube reaction 25µL On-chip reaction Final DNA concentration (ug/mL)
On-chip helicase dependent amplification
fluorescence chemistries
Real-time plot of HDA reaction
Fluorescence
Time (minutes)
0 5 10 15 20 25 30 35 40
Negative control Positive Control
12/19
Fluorescence detection on microfluidic chip
490nm LED Amplified Photodiode Emission band-pass Filter (530nm) Optical Fibre 3mm PMMA Reaction Chamber PMMA Fluidic Chip
Finite element analysis of microfluidic chip to characterise thermal properties 25µL microfluidic chip
13/19
14/19
Planar Inductor Simulation, Magnetic Flux Density = 4 - 16 mT Simple circuitry to allow detection of magnetic beads
15/19
Brass/Al mould for a detection microfluidic device Detection device with automated fluid flow and electrodes Al mould for a fully integrated microfluidic system Integrated microfluidic PDMS device
10mm 10mm
10mm
16/19
17/19
Wax penetration: comparison of printed barriers before and after curing at 120oC for 15 minutes
Printed barriers of 500 µm produced fully functional barriers. A minimum channel width of ~ 300 µm is achievable. Printed barriers (Wax) Cured barriers (Wax) Xerox ColorQubeTM 8570N solid ink Printer Multiplexing: A single sample effectively delivered into 5 test zones DNA mobility on a µPAD Inkjet printed silver electrodes (25 µm)
18/19
0 s 30 s 90 s W 1 W 2
0s – Blank 30s – 20uL FITC tagged 25mer DNA sample advancing (0.01nM). 90s – Further movement of the sample into the waste zone. W1 – DNA sample getting washed away by water into the waste zone. W2 – Further washing of the DNA by water into the waste zone.
Water as control Blank paper as control Serially diluted 0.1pM DNA Serially diluted 1pM DNA Serially diluted 0.01nM DNA Stock DNA solution 0.1nM
All above pictures are obtained through the BIO-RAD Gel DOCTM XR+ system and the associated image analysis software Image LabTM.
19/19
Future GUI
Current handheld platform in development