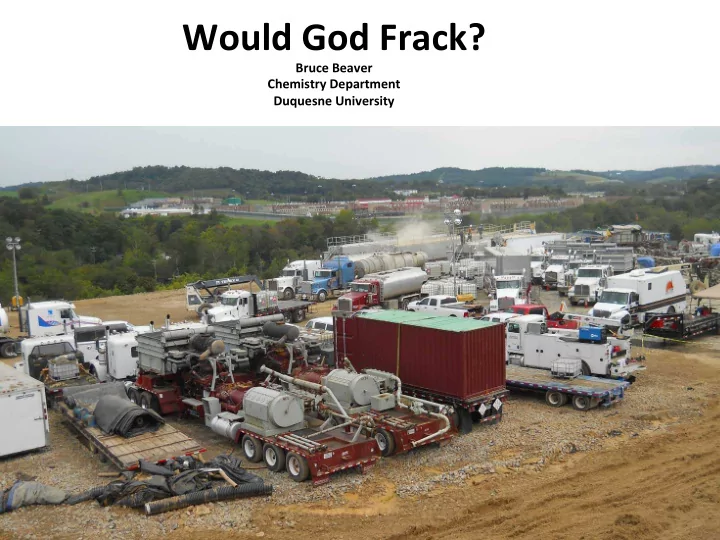
SLIDE 1 Would ¡God ¡Frack? ¡
Bruce ¡Beaver ¡ Chemistry ¡Department ¡ Duquesne ¡University ¡
SLIDE 2 The ¡Ethics ¡of ¡Fracking ¡
h#p://www.youtube.com/watch?v=fd1IAw242yY ¡ ¡
- Holy ¡Cross ¡Br. ¡David ¡Andrews, ¡senior ¡
representaGve ¡of ¡Earth ¡& ¡Water ¡Watch, ¡ shares ¡that ¡his ¡God, ¡being ¡a ¡God ¡of ¡JusGce, ¡ Truth, ¡Honesty, ¡and ¡Integrity, ¡would ¡not ¡frack. ¡
- Br. ¡Andrews ¡suggests ¡that ¡fracking ¡is ¡bad ¡for ¡
communiGes, ¡animals, ¡and ¡the ¡environment ¡ and ¡can ¡spew ¡toxicity ¡everywhere. ¡ ¡
SLIDE 3 Hydraulic ¡Fracturing ¡(h#p://www.youtube.com/
watch?v=VY34PQUiwOQ) ¡ ¡
- High ¡pressure ¡water ¡cracks ¡deep ¡shale ¡
formaGons ¡& ¡propels ¡proppant ¡into ¡cracks ¡
- Gas ¡and/or ¡crude ¡flow ¡to ¡the ¡surface ¡with ¡
significant ¡amounts ¡of ¡brine ¡
- The ¡brine ¡is ¡saturated ¡with ¡toxic ¡hydrocarbons ¡
like ¡benzene ¡
SLIDE 4
SLIDE 5
SLIDE 6
Can ¡unconvenBonal ¡shale ¡development ¡ ¡ in ¡South ¡Africa ¡promote ¡authenBc ¡ human ¡development? ¡
SLIDE 7
SLIDE 8 US ¡EIA ¡2013 ¡Unproved ¡Wet ¡Gas ¡Reserves ¡ (global ¡consumpBon ¡2010 ¡= ¡113 ¡tcf) ¡
Trillion ¡cubic ¡feet ¡(tcf) ¡technically ¡ recoverable ¡ China ¡ 1115 ¡ UK ¡ 26 ¡ US ¡ 567 ¡ Canada ¡ 573 ¡ South ¡Africa ¡ 390 ¡ EU ¡ 470 ¡ Australia ¡ 437 ¡ Global ¡Reserves ¡ 7201 ¡(~50 ¡year ¡supply) ¡
SLIDE 9
Karoo ¡Basin ¡Shale ¡Gas ¡Development? ¡
SLIDE 10 Natural ¡Gas ¡for ¡Future ¡Electricity ¡ GeneraBon ¡(Risks/Benefits) ¡
- The ¡Need ¡
- Health/Safety/Environmental ¡Issues ¡
- Carbon ¡Emissions ¡Issues ¡
- Costs ¡$ ¡
SLIDE 11 The ¡Need: ¡World ¡Bank ¡ EsBmates ¡
- 20% ¡global ¡populaGon ¡without ¡electricity ¡
– 1.2 ¡billion ¡people ¡(550M ¡in ¡India, ¡400M ¡ Asia) ¡ – 2.8 ¡billion ¡use ¡solid ¡fuel ¡for ¡heat ¡& ¡cooking ¡ – Results ¡in ¡~1.5 ¡million ¡deaths ¡from ¡ emphysema ¡and ¡related ¡respiratory ¡ diseases ¡
SLIDE 12 2011 ¡South ¡African ¡Census ¡
- 52 ¡million ¡
- Avg. ¡white ¡household ¡income ¡$42K ¡(R ¡365,000) ¡
- Avg. ¡black ¡household ¡income ¡$8K ¡(R ¡60,000) ¡
- 9 ¡million ¡households ¡(1994-‑2013 ¡1.4 ¡million ¡built) ¡
- 2 ¡million ¡shacks ¡(by ¡2014 ¡all ¡were ¡to ¡be ¡out ¡of ¡shacks) ¡
- Only ¡57% ¡have ¡a ¡flush ¡toilet ¡
- Only ¡85% ¡have ¡electric ¡
SLIDE 13
Cape ¡Town, ¡South ¡Africa ¡
SLIDE 14
SLIDE 15
SLIDE 16 Cape ¡Town, ¡South ¡Africa, ¡Khayelitsha ¡ h#p://www.bloomberg.com/news/2013-‑08-‑01/south-‑africa-‑s-‑post-‑apartheid-‑failure-‑ in-‑shantytowns.html ¡
SLIDE 17
Shanty ¡
SLIDE 18
Seweto ¡$11K ¡Subsidized ¡Home ¡
SLIDE 19
Social ¡Unrest ¡from ¡Slow ¡Pace ¡of ¡RDP ¡
SLIDE 20 Natural ¡Gas ¡for ¡Future ¡Electricity ¡ GeneraBon ¡(Risks/Benefits) ¡
- The ¡Need ¡
- Health/Safety/Environmental ¡Issues ¡
- Carbon ¡Emissions ¡Issues ¡
- Costs ¡$ ¡
SLIDE 21 Electricity ¡GeneraBon: ¡Health ¡& ¡ Safety ¡ ¡
- European ¡energy ¡cycles ¡
- Coal ¡= ¡average ¡25 ¡deaths ¡per ¡TWh ¡
- Natural ¡Gas ¡= ¡average ¡3 ¡deaths ¡per ¡TWh ¡
- Deaths ¡= ¡accidental ¡& ¡polluGon ¡related ¡
¡
- Source: ¡ ¡A. ¡Markandya ¡& ¡P. ¡Wilkinson, ¡The ¡Lancet, ¡2007, ¡370, ¡979-‑990. ¡
SLIDE 22 Royal ¡Society ¡of ¡Engineering ¡2012 ¡peer ¡reviewed ¡report: ¡ ¡ Shale ¡gas ¡extracBon ¡in ¡the ¡UK: ¡a ¡review ¡of ¡hydraulic ¡
- fracturing. ¡ ¡
- “The ¡health, ¡safety ¡and ¡environmental ¡risks ¡
associated ¡with ¡hydraulic ¡fracturing ¡(olen ¡ termed ¡‘fracking’) ¡as ¡a ¡means ¡to ¡extract ¡shale ¡ gas ¡can ¡be ¡managed ¡effecGvely ¡in ¡the ¡UK ¡as ¡ long ¡as ¡operaGonal ¡best ¡pracGces ¡are ¡ implemented ¡and ¡enforced ¡through ¡
- regulaGon. ¡Hydraulic ¡fracturing ¡is ¡an ¡
established ¡technology ¡that ¡has ¡been ¡used ¡in ¡ the ¡oil ¡and ¡gas ¡industries ¡for ¡many ¡decades.” ¡ ¡
SLIDE 23 Water ¡impacts ¡during ¡shale ¡gas ¡development ¡in ¡PA. ¡S. ¡
- L. ¡Brantley ¡et ¡al., ¡Int. ¡J. ¡Coal ¡Geo.126 ¡(2014) ¡140-‑156. ¡
- water ¡issues ¡from ¡state ¡regulator ¡acGvity ¡of ¡oil ¡and ¡gas ¡
development ¡in ¡Pennsylvania ¡from ¡2008-‑2012 ¡ ¡
- During ¡this ¡period ¡> ¡6000 ¡wells ¡were ¡drilled ¡and ¡>4000 ¡
were ¡completed ¡(e.g. ¡fractured). ¡ ¡
- approximately ¡20 ¡unconvenGonal ¡wells ¡have ¡
unambiguously ¡contaminated ¡water ¡while ¡30 ¡large ¡ spills ¡have ¡also ¡occurred. ¡Most ¡of ¡well ¡water ¡ contaminaGon ¡incidents ¡involved ¡faulty ¡well ¡casings ¡ (0.24% ¡of ¡spudded ¡wells) ¡which ¡permi#ed ¡methane ¡ migraGon ¡into ¡the ¡wells. ¡The ¡most ¡famous ¡incident ¡
- ccurred ¡in ¡Dimock, ¡PA, ¡where ¡a ¡faulty ¡well ¡casings ¡
increased ¡residenGal ¡well ¡methane ¡levels ¡in ¡18 ¡homes. ¡ ¡
SLIDE 24 Natural ¡Gas ¡for ¡Future ¡Electricity ¡ GeneraBon ¡(Risks/Benefits) ¡
- The ¡Need ¡
- Health/Safety/Environmental ¡Issues ¡
- Carbon ¡Emissions ¡Issues ¡
- Costs ¡$ ¡
SLIDE 25 2005-‑2013 ¡Carbon ¡Emissions ¡
- Germany ¡(-‑3.5%) ¡
- E.U. ¡28 ¡(-‑14%) ¡
- U.S. ¡(-‑10%) ¡
SLIDE 26 Natural ¡Gas ¡for ¡Future ¡Electricity ¡ GeneraBon ¡(Risks/Benefits) ¡
- The ¡Need ¡
- Health/Safety/Environmental ¡Issues ¡
- Carbon ¡Emissions ¡Issues ¡
- Costs ¡$ ¡
SLIDE 27 Natural ¡Gas ¡Prices ¡
- Cheap ¡global ¡natural ¡gas ¡is ¡vital ¡for ¡health, ¡
development, ¡and ¡addressing ¡environmental ¡
SLIDE 28 Global ¡Gas ¡Prices ¡$/MmBtu ¡
Source: ¡BP ¡staBsBcal ¡review ¡of ¡energy ¡2014 ¡
3 6 9 12 18 US Henry Hub Average German Import Price cif UK NBP Japan LNG cif 13 12 11 10 09 08 99 98 96 97 01 02 00 03 05 06 04 07 15
SLIDE 29 Average ¡Global ¡Electricity ¡Costs ¡U.S. ¡cents/kWh ¡ ¡ 2011 ¡PPP ¡source-‑shrinkthacootprint.com ¡
- Germany ¡32 ¡
- Spain ¡30 ¡
- Denmark ¡28 ¡
- UK ¡20 ¡
- India ¡19 ¡
- South ¡Africa ¡14 ¡
- USA ¡11 ¡
- Canada ¡(8) ¡ON ¡15 ¡(2013) ¡expected ¡to ¡increase ¡
45% ¡in ¡5 ¡years ¡h#p://business.financialpost.com/2014/06/02/ontarios-‑power-‑trip-‑irraGonal-‑energy-‑
planning-‑tripling-‑power-‑rates-‑under-‑the-‑liberals-‑direcGon/ ¡
SLIDE 30 2014 ¡US ¡EIA ¡Cost ¡EsBmates ¡for ¡ElecBc ¡ GeneraBon ¡in ¡2019 ¡
¡ ¡Technology ¡2012$/MWh ¡
– 85 ¡ ¡ ¡ ¡ ¡ ¡Conv. ¡Coal ¡ ¡95.6 ¡ – 87 ¡ ¡ ¡Gas-‑fired ¡Adv. ¡Comb. ¡Cycle ¡64.4 ¡ – 90 ¡ ¡ ¡ ¡ ¡ ¡Adv. ¡Nuclear ¡ ¡96.1 ¡ – 35 ¡ ¡ ¡ ¡ ¡ ¡Wind ¡ ¡ ¡80.3 ¡(+21.5 ¡tax ¡credit) ¡ – 25 ¡ ¡ ¡ ¡ ¡ ¡Solar ¡PV ¡ ¡ ¡130.0 ¡ – 53 ¡ ¡ ¡ ¡ ¡ ¡Hydro ¡ ¡ ¡84.5 ¡ – 93 ¡ ¡ ¡ ¡ ¡ ¡Geothermal ¡ ¡43.7 ¡
SLIDE 31 Fuel ¡Poverty ¡
- UK ¡has ¡most ¡thoroughly ¡studied ¡fuel ¡poverty(> ¡
10% ¡of ¡income ¡spent ¡on ¡heat) ¡ h#p://www.youtube.com/watch? v=HNYlE3sOeII ¡
- 2003-‑2011 ¡households ¡in ¡fuel ¡poverty ¡
increased ¡from ¡2.2-‑6.3 ¡million ¡which ¡is ¡17% ¡of ¡ households ¡
- This ¡correlates ¡with ¡an ¡esGmated ¡~24 ¡K ¡deaths ¡
last ¡winter ¡
SLIDE 32 Germany ¡& ¡Energiewende ¡
- Green ¡electricity ¡(wind, ¡solar) ¡ ¡went ¡from ¡6% ¡to ¡20 ¡% ¡between ¡
2001-‑ ¡2013 ¡(3/4 ¡cost ¡not ¡captured ¡by ¡electric ¡rates ¡) ¡
- Nuclear ¡energy ¡is ¡being ¡ ¡phased ¡out ¡(8 ¡reactors ¡decommissioned ¡in ¡
2012) ¡
- Coal ¡is ¡replacing ¡Nuclear ¡(2012 ¡5% ¡increase ¡in ¡coal ¡combusGon ¡
resulted ¡in ¡net ¡1% ¡increase ¡GHG ¡emissions ¡for ¡2012) ¡
- Exports ¡decreased ¡52B ¡Euro ¡2008-‑2013-‑FT-‑27 ¡Feb, ¡2014 ¡
(DeindustrializaGon ¡?) ¡
- Households ¡in ¡fuel ¡poverty ¡increased ¡from ¡12 ¡to ¡16% ¡between ¡
2011-‑2013 ¡
- Detailed ¡discussion ¡see ¡
h#p://www.dissentmagazine.org/arGcle/green-‑energy-‑bust-‑in-‑ germany ¡ ¡
SLIDE 33
Reason ¡US ¡Gas ¡Cheap. ¡Source ¡PADEP ¡
SLIDE 34
SLIDE 35
SLIDE 36
Can ¡unconvenBonal ¡shale ¡development ¡ ¡ in ¡South ¡Africa ¡promote ¡authenBc ¡ human ¡development? ¡
SLIDE 37 Development ¡PotenBal ¡ CIA ¡Fact ¡Book ¡(2013) ¡
South ¡Africa ¡ European ¡Union ¡ Unemployment ¡rate ¡ 25% ¡ 10.5% ¡ GDP-‑per ¡capita-‑ ¡US ¡dollars ¡ 2013 ¡ $11,400 ¡ $34,500 ¡ Infant ¡mortality ¡per ¡1000 ¡ births ¡ 42 ¡ 4.4 ¡ Life ¡expectancy-‑male-‑ ¡yrs. ¡ at ¡birth ¡ 49.6 ¡ 77.0 ¡ Life ¡expectancy-‑female-‑yrs. ¡ at ¡birth ¡ ¡ 50.5 ¡ 82.9 ¡
SLIDE 38 Fracking ¡in ¡South ¡Africa: ¡Blessing ¡or ¡Curse? ¡ African ¡Future ¡Paper ¡No. ¡9, ¡Dec. ¡2013 ¡
- Blue ¡Ridge ¡Scenario ¡ ¡ ¡2017-‑2050 ¡escalaGng ¡
tax ¡on ¡shale ¡gas ¡to ¡finance ¡renewable ¡energy ¡ development ¡
- EsGmated ¡to ¡increase ¡per ¡capita ¡GDP ¡in ¡2050 ¡
by ¡USD ¡1,200 ¡(400,000 ¡fewer ¡in ¡poverty) ¡
- Also ¡would ¡increase ¡spending ¡by ¡US$ ¡90 ¡
Billion ¡on ¡health ¡care, ¡educaGon, ¡ infrastructure ¡
SLIDE 39 What ¡does ¡it ¡all ¡mean? ¡
- UnconvenGonal ¡gas ¡development ¡can ¡be ¡done ¡safely ¡with ¡
minimal ¡health ¡& ¡environmental ¡impact ¡
- US ¡experience ¡has ¡shown ¡that ¡unconvenGonal ¡drilling ¡can ¡
decrease ¡natural ¡gas ¡price ¡(decrease ¡global ¡fuel ¡poverty) ¡
- Shale ¡gas ¡deposits ¡are ¡global ¡& ¡can ¡address ¡global ¡
development ¡(parBcularly ¡in ¡South ¡Africa) ¡
- Natural ¡gas ¡is ¡clean ¡burning ¡(i.e. ¡soot, ¡Hg, ¡sulfur) ¡ ¡
- Energy ¡content ¡of ¡natural ¡gas ¡can ¡cut ¡carbon ¡emissions ¡in ¡half ¡
relaGve ¡to ¡coal ¡globally ¡
- For ¡all ¡of ¡these ¡reasons ¡I ¡believe ¡that ¡God ¡intends ¡us ¡to ¡frack ¡
sustainably ¡
SLIDE 40
Would ¡God ¡Frack? ¡Yes, ¡I ¡believe ¡because ¡it ¡is ¡ the ¡best ¡way ¡forward ¡in ¡terms ¡of ¡authenBc ¡ human ¡development. ¡Thank ¡you ¡
SLIDE 41 ¡ Methane ¡FugiBve ¡Emissions ¡
- Switching ¡out ¡coal ¡with ¡natural ¡gas ¡for ¡
electricity ¡producGon ¡with ¡2.2% ¡methane ¡ emissions ¡cuts ¡carbon ¡emissions ¡in ¡half ¡
- EPA-‑Carbon ¡Emission ¡Inventory-‑2013-‑
methane ¡emissions-‑ ¡11% ¡decline ¡Vs ¡1990 ¡ emissions ¡
- Larry ¡Cathles ¡et ¡al., ¡ClimaGc ¡Change, ¡(2012) ¡
113: ¡525-‑35. ¡
SLIDE 42
SLIDE 43
SLIDE 44