winter school 2 july 2012
play

Winter School, 2 July 2012 Why do RNA-seq? Differential expression - PDF document

Differential Expression Analysis of Gordon Smyth RNA-Seq Read Counts Winter School, 2 July 2012 Why do RNA-seq? Differential expression analysis of Discover new exons, transcripts etc RNA-seq read counts Quantify the expression levels of


  1. Differential Expression Analysis of Gordon Smyth RNA-Seq Read Counts Winter School, 2 July 2012 Why do RNA-seq? Differential expression analysis of Discover new exons, transcripts etc RNA-seq read counts Quantify the expression levels of individual transcripts for the same gene Gordon Smyth An improved expression platform for pre- defined genomic features Winter School 2 July 2012 1 2 Why do RNA-seq? Why do RNA-seq? Discover new exons, transcripts etc Discover new exons, transcripts etc Quantify the expression levels of individual Quantify the expression levels of individual transcripts for the same gene transcripts for the same gene An improved expression platform for pre- An improved expression platform for pre- defined genomic features defined genomic features This talk is about gene-level differential expression analysis using existing gene models 3 4 Typical two group RNA-Seq experiment 
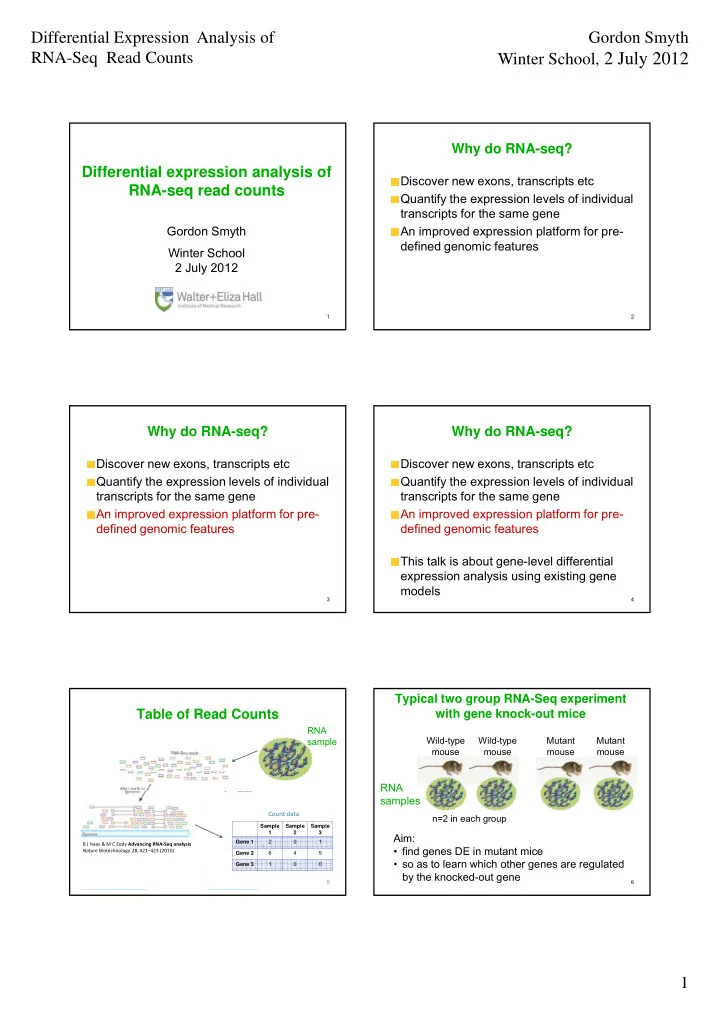
Table of Read Counts with gene knock-out mice RNA sample Wild-type Wild-type Mutant Mutant mouse mouse mouse mouse RNA samples Count data n=2 in each group Sample Sample Sample 1 2 3 Aim: 2 0 1 Gene 1 B J Haas & M C Zody Advancing RNA-Seq analysis • find genes DE in mutant mice Nature Biotechnology 28, 421–423 (2010) 6 4 5 Gene 2 • so as to learn which other genes are regulated 1 0 0 Gene 3 by the knocked-out gene 5 6 1

  2. Differential Expression Analysis of Gordon Smyth RNA-Seq Read Counts Winter School, 2 July 2012 Count table summarizes the Genomic DE analysis is crazy! results of the experiment from a classical statistical point of view Estimate parameters and test for DE for Wild-type Mutant 30,000 or more genes … from 4 samples Mouse1 Mouse2 Mouse1 Mouse2 Gene 1 45 60 30 39 Ultra high-dimensional data Ultra high dimensional data Gene 2 0 4 3 7 Tiny sample sizes Gene 3 1010 800 3099 3450 Need innovative statistical strategies that ... ... ... ... ... take advantage of the data structure Total 20m 16m 15m 17m I use all reads mapping to exons for each gene 7 8 Read counts estimate RNA concentration RNA sample Count variation arises from both biological and technical sources g M = total number of reads (library size) M t t l b f d (lib i ) ≈ 20 million λ g = proportion of RNA in sample from gene g y g = number of reads for gene g E(y g ) = µ g = M λ g Genes g = 1, …, ≈ 30k 9 10 Back to the two-group RNA-seq experiment Sources of variation Mutant mice Wild type mice Mutant mice Wild-type mice λ λ g1 λ λ g2 λ λ g3 λ g4 λ Biological Biological λ g1 λ g2 λ g3 λ g4 variation M 3 M 4 M 1 M 2 M 3 M 4 M 1 M 2 y g2 y g3 y g4 y g1 Measurement y g3 y g4 y g1 y g2 error E(y gi ) = µ gi = M i λ gi for gene g in sample i Variation in y is mixture of biological (multiplicative) 11 and measurement (Poisson) 12 2

  3. Differential Expression Analysis of Gordon Smyth RNA-Seq Read Counts Winter School, 2 July 2012 Mixture structure implies a quadratic Biological coefficient of variation mean-variance relationship Total CV 2 = Technical CV 2 + Biological CV 2 var(y gi ) = μ gi + φ g μ gi 2 From CV of “true” sequencing q g expression p technology level CV 2 of the “true” Poisson variation expression levels λ gi zero for large ≈ constant across replicates counts BCV = √φ g CV = coefficient of variation = sd/mean 13 14 An experiment with technical True technical reps show Poisson replicates variation for each gene wild-type mouse Mutant mouse BCV ≈ 0 λ g3 λ g4 λ g2 λ g1 M 3 M 4 M 1 M 2 Data from y g1 y g2 y g3 y g4 Marioni et al., Genome Res, 2008 15 16 binned variance, sample variance Real data with biological replicate show quadratic mean-variance relationships Estimating biological variability, and borrowing strength between BCV = genes genes 0 38 0.38 Data from Parikh et al, Genome Biology, 2010 17 18 binned variance, sample variance 3

  4. Differential Expression Analysis of Gordon Smyth RNA-Seq Read Counts Winter School, 2 July 2012 Complexity of dispersion: edgeR negative binomial approach sharing information between genes If λ gi are gamma distributed, then Separate gene-wise estimation of φ g is impractical y gi ~ NegBin( μ gi , φ g ) Common dispersion (Robinson & Smyth 2008) 2008) We use a conditional likelihood approach to obtain approximately unbiased Trended dispersion (Anders & Huber 2010) estimates for the dispersions φ g even in small samples Gene-wise by empirical Bayes shrinkage (Robinson & Smyth, 2007) 19 20 Empirical Bayes squeezing Common dispersion likelihood of the genewise dispersions Assumes same dispersion for all genes Estimate φ g by empirical posterior mode: φ g = φ Posterior = ℓ g ( φ g ) + α ℓ c ( φ c ) Genewise conditional log-likelihood Genewise conditional log likelihood Genewise Empirical prior ℓ g ( φ ;y g ) Precision likelihood distribution of prior Common-dispersion log-likelihood ℓ c ( φ ) = (1/G) ∑ g ℓ g ( φ ;y g ) Maximized at φ c 21 22 Usually BCV is somewhat larger for Empirical Bayes squeezing small counts of the genewise dispersions Estimate φ g by empirical posterior mode: Posterior = ℓ g ( φ g ) + α ℓ c ( φ c ) Genewise Empirical prior Mouse Precision likelihood distribution lymphomas of prior (Stan Lee) Local weighting produces abundance dependent prior 23 4

  5. Differential Expression Analysis of Gordon Smyth RNA-Seq Read Counts Winter School, 2 July 2012 And often we can identify hyper- BCV can show a strong trend variable genes (for technical reasons) Pu1 Restoration in Leukemia Mouse hemapoeitic Ighv 1-42 1.2 Ighv 1-85 Ighv 5-9 stem cells, Gm16891 Gm16969 Ighv 1-84 Gm16901 NuGEN 1.0 Gm16965 amplified p Gm16814 on .8 Tagwise Dispersi 0 (Samir Taoudi) Gm16746 Ighv 5-17 Mouse pre Igkv 12-44 0.6 Igkv 17-127 Ighv 1-54 B cell Igkv 5-43 Common leukaemias 0.4 dispersion (Mark 0.2 Asymptotic McKenzie) dispersion 0.0 -20 -18 -16 -14 -12 -10 -8 -6 25 log2 Common Concentration Empirical Bayes improves accuracy of genewise dispersion estimation Separate estimation Emp Bayes Biological variation is gene-specific compromise Common Common dispersion 27 28 Genewise goodness of fit tests Genewise goodness of fit tests Matched tumour and normal tissue samples from Prostate adenocarcinoma cell line from Li et al 2008 Tuch et al (2010), BCV = 40% Low biological variability, BCV=14% 5

  6. Differential Expression Analysis of Gordon Smyth RNA-Seq Read Counts Winter School, 2 July 2012 Need gene-specific dispersions to prioritize less variable genes Top 4 genes using Top 4 genes using trended dispersions genewise dispersions More complex experiments 32 Plt8 vs Suz12 wt lymphomas Oral squamous cancer: paired Ignoring patient differences will normal and tumour samples over-estimate variability Normal Tumour tissue tissue Difference Patient 8 N8 T8 between cancer cancer Patient 33 Patient 33 N33 N33 T33 T33 Normal Normal and Cancer Patient 51 N51 T51 normal samples looks not Aim: find genes DE in tumour tissue, adjusting significant for differences between patients Tuch et al, PloS ONE 2010 33 34 Consistent DE is found after Use log-linear models for general accounting for baseline patient effects experimental design log μ gi = log λ ig + log M gi 2-fold difference = x i T β g + log M gi Patient 1 between P ti Patient 2 t 2 cancer and row of (normalized) vector of Patient 3 normal design library size within each log fold patient matrix changes (unknown) Normal Cancer 35 36 6

  7. Differential Expression Analysis of Gordon Smyth RNA-Seq Read Counts Winter School, 2 July 2012 Oral squamous cancer Simulation study Normal Tumour Tuch et al, Patient 8 N8 T8 Abundances based on real data PloS ONE 2010 Patient 33 N33 T33 Patient 51 N51 T51 10000 genes, 200 DE 3 vs 3 sample comparison Detect 1271 library sizes alternate between 2 million generally DE genes + and 20 million 184 genes specific Gamma-Poisson mixture to individual tumours Trended biological variation with genewise BCV=40% FDR < 0.05 variation around trend 37 38 The edgeR NB approach achieves RNA-Seq vs. Microarray (5% FDR) good FDR performance Log Fold Changes (8295 Overlaps) 1107 both up 1167 both down Dox3d vs. Untreated 4 Ikzf1 overies 2 s. untreated RNASeq Microarray False disco 0 0 RNASeq : dox3d vs 2056 1107 234 2031 1167 182 -2 up 9706 down 9723 -4 -6 -4 -3 -2 -1 0 1 2 3 39 40 Number of DE genes Microarray : dox3d vs. untreated Genes DE in RNA-Seq but missing on microarray Microarray DE genes in RNA-Seq Dox3d vs. Untreated t stats: top DE Genes from Microarray Untreated Dox3d Microarrray Top DE Genes 117 up 76 down 41 42 7

  8. Differential Expression Analysis of Gordon Smyth RNA-Seq Read Counts Winter School, 2 July 2012 Acknowledgements Conclusions Collaborators edgeR team Model the mean-variance relationship Samir Taoudi Davis McCarthy Estimate gene-specific biological variation Stanley Lee Yunshun Chen Borrow strength between genes Warren Alexander Mark Robinson Linear modelling for multi-factor Mark McKenzie Yifang Hu Ross Dickins experiments Belinda Phipson Wei Shi Yang Liao 43 44 8

Download Presentation
Download Policy: The content available on the website is offered to you 'AS IS' for your personal information and use only. It cannot be commercialized, licensed, or distributed on other websites without prior consent from the author. To download a presentation, simply click this link. If you encounter any difficulties during the download process, it's possible that the publisher has removed the file from their server.

Recommend


More recommend