
SLIDE 1
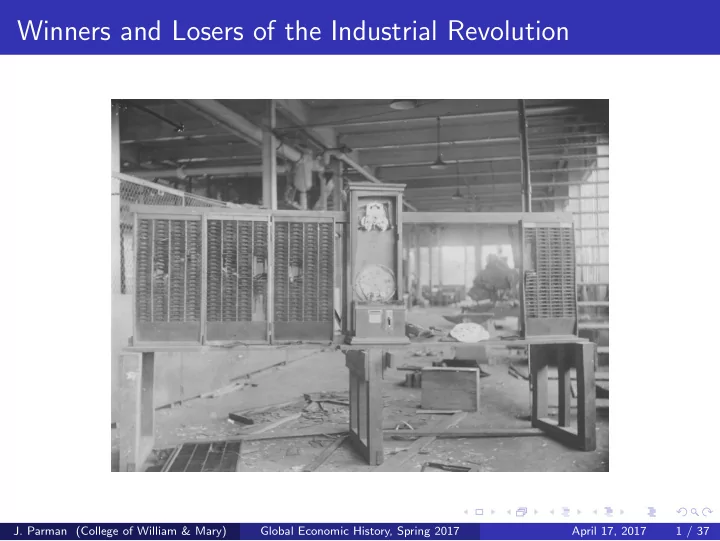
Winners and Losers of the Industrial Revolution
- J. Parman (College of William & Mary)
Global Economic History, Spring 2017 April 17, 2017 1 / 37
Winners and Losers of the Industrial Revolution J. Parman (College - - PowerPoint PPT Presentation
Winners and Losers of the Industrial Revolution J. Parman (College of William & Mary) Global Economic History, Spring 2017 April 17, 2017 1 / 37 The Benefits of the Industrial Revolution How were the benefits of the Industrial Revolution
Global Economic History, Spring 2017 April 17, 2017 1 / 37
Global Economic History, Spring 2017 April 17, 2017 2 / 37
Global Economic History, Spring 2017 April 17, 2017 3 / 37
Global Economic History, Spring 2017 April 17, 2017 4 / 37
Global Economic History, Spring 2017 April 17, 2017 5 / 37
Global Economic History, Spring 2017 April 17, 2017 6 / 37
Global Economic History, Spring 2017 April 17, 2017 7 / 37
Global Economic History, Spring 2017 April 17, 2017 8 / 37
Global Economic History, Spring 2017 April 17, 2017 9 / 37
Global Economic History, Spring 2017 April 17, 2017 10 / 37
Global Economic History, Spring 2017 April 17, 2017 11 / 37
Global Economic History, Spring 2017 April 17, 2017 12 / 37
Global Economic History, Spring 2017 April 17, 2017 13 / 37
Global Economic History, Spring 2017 April 17, 2017 14 / 37
Global Economic History, Spring 2017 April 17, 2017 15 / 37
Global Economic History, Spring 2017 April 17, 2017 16 / 37
Global Economic History, Spring 2017 April 17, 2017 17 / 37
Global Economic History, Spring 2017 April 17, 2017 18 / 37
Global Economic History, Spring 2017 April 17, 2017 19 / 37
Global Economic History, Spring 2017 April 17, 2017 20 / 37
Global Economic History, Spring 2017 April 17, 2017 21 / 37
Global Economic History, Spring 2017 April 17, 2017 22 / 37
Global Economic History, Spring 2017 April 17, 2017 23 / 37
Global Economic History, Spring 2017 April 17, 2017 24 / 37
Global Economic History, Spring 2017 April 17, 2017 25 / 37
Global Economic History, Spring 2017 April 17, 2017 26 / 37
Global Economic History, Spring 2017 April 17, 2017 27 / 37
Global Economic History, Spring 2017 April 17, 2017 28 / 37
Global Economic History, Spring 2017 April 17, 2017 29 / 37
Global Economic History, Spring 2017 April 17, 2017 30 / 37
Global Economic History, Spring 2017 April 17, 2017 31 / 37
Rank Name Wealth Lifetime Industry 1 John D. Rockefeller $192 billion 1839‐1937 Standard Oil 2 Commodore Cornelius Vanderbilt $143 billion 1794‐1877 steamboats and railroads 3 John Jacob Astor $116 billion 1763‐1848 fur trader, NYC real estate 4 Stephen Girard $83 billion 1750‐1831 shipping 5 Bill Gates $82 billion 1955‐ Microsoft 6 Andrew Carnegie $75 billion 1835‐1919 steel 7 A.T. Stewart $70 billion 1803‐1876 department stores 8 Frederick Weyerhaeuser $68 billion 1834‐1914 lumber 9 Jay Gould $67 billion 1836‐1892 railroad, "Mephistopheles of Wall Street" 10 Stephen Van Rensselaer $64 billion 1764‐1839 patroon (aristocrat granted land by the Dutch) The Ten Wealthiest Americans
Global Economic History, Spring 2017 April 17, 2017 32 / 37
Global Economic History, Spring 2017 April 17, 2017 33 / 37
Global Economic History, Spring 2017 April 17, 2017 34 / 37
Global Economic History, Spring 2017 April 17, 2017 35 / 37
Global Economic History, Spring 2017 April 17, 2017 36 / 37
Global Economic History, Spring 2017 April 17, 2017 37 / 37