
SLIDE 1
Software Engineering
- Prof. Dr. Bertrand Meyer
March 2007 – June 2007
Chair of Softw are Engineering
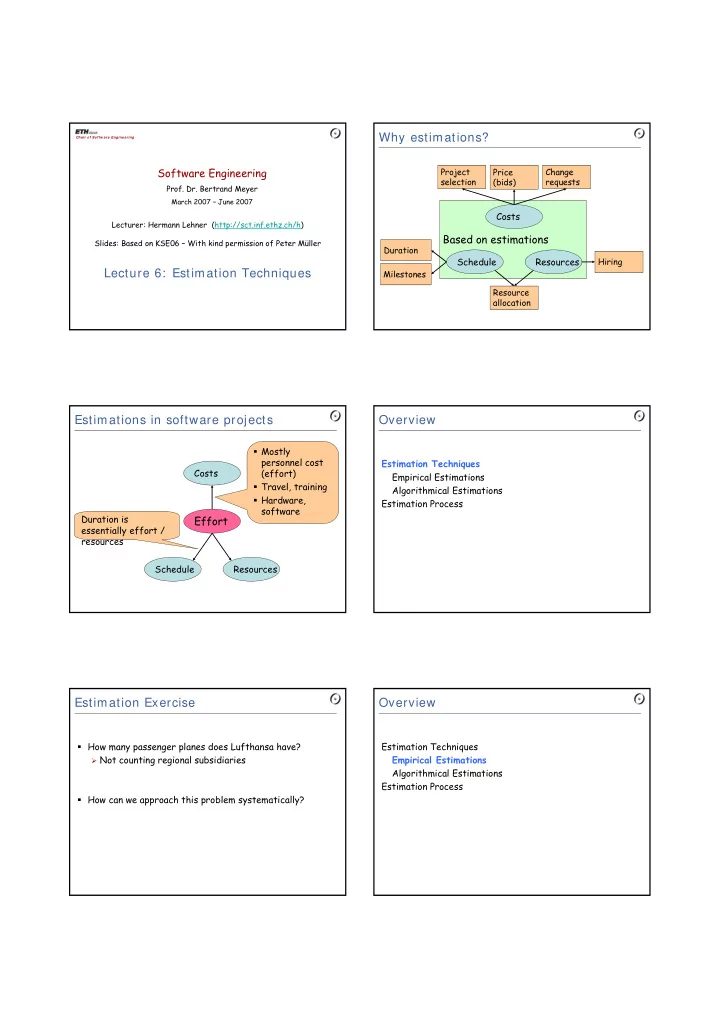
Why estimations? Chair of Softw are Engineering Software - - PDF document
Why estimations? Chair of Softw are Engineering Software Engineering Project Change Price selection (bids) requests Prof. Dr. Bertrand Meyer March 2007 June 2007 Costs Lecturer: Hermann Lehner (http://sct.inf.ethz.ch/h) Based on
Chair of Softw are Engineering