
SLIDE 1
WHAT WOULD TREX DO?
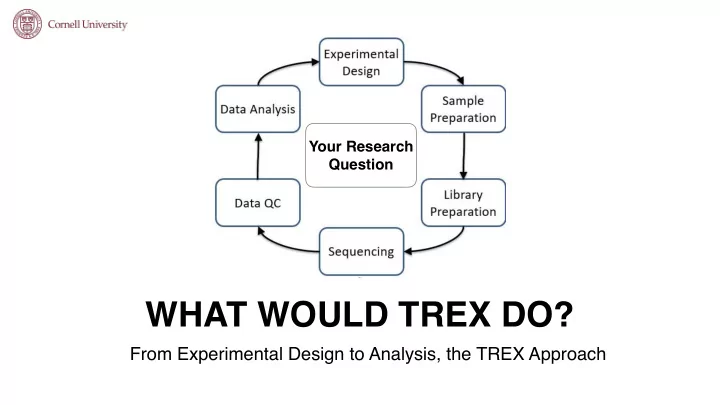
From Experimental Design to Analysis, the TREX Approach
Your Research Question
WHAT WOULD TREX DO? From Experimental Design to Analysis, the TREX - - PowerPoint PPT Presentation
Your Research Question WHAT WOULD TREX DO? From Experimental Design to Analysis, the TREX Approach EXPERIMENTAL DESIGN What are my research goals? FFPE Clinical Where are my samples coming from? Fresh Tissue/Cells How much RNA
From Experimental Design to Analysis, the TREX Approach
Your Research Question
FFPE Clinical Fresh Tissue/Cells FACS Sorted Cells
Control Treatment Gene Expression Variation Gene Expression Variation
Clinical Cultured Cells Biological > Technical
SAMPLE PREPARATION/ EXTRACTION
quantity
260/230 = 0.81 260/280 = 1.82 260/230 = 2.09 260/280 = 1.65
Number
Lower Marker Small RNA Small Ribosomal Subunit Large Ribosomal Subunit RQN:9.6 RQN:6.8 RQN:2.3 DNA Contamination
contamination
Core
NEB Next Ultra II RNASeq
MULTIQC SUMMARY REPORT
RQN 6.8
Diagnostic Plots
Overall quality Biological Signal
Diagnostic Plots
Diagnostic Plots
Color = Treatment Group Multiple data points with same color indicate biological reps
Diagnostic Plots
Bottom-up approach
RQN 6.8
RQN 6.8 Borderline OKAY sample
Case Study 1
RQN 7.1
RQN 7.1
Case Study 2
Summary Report
TREX Analysis Reports
Next Steps…
Enrichment;
Contact Info: http://rnaseqcore.vet.cornell.edu/ E-mail List Serve: TREX-GENEREG-L Jen Grenier: jgrenier@cornell.edu Christine Butler: cab18@cornell.edu Ann Tate: aef93@cornell.edu Faraz Ahmed: fahmed@cornell.edu