
SLIDE 1
What S t Scien ence H e Have W e We Learned ed f from O Our C Combined ed A Airborne e and G Ground-based ed Measurem emen ents o
- f H
What S t Scien ence H e Have W e We Learned ed f from O Our C - - PowerPoint PPT Presentation
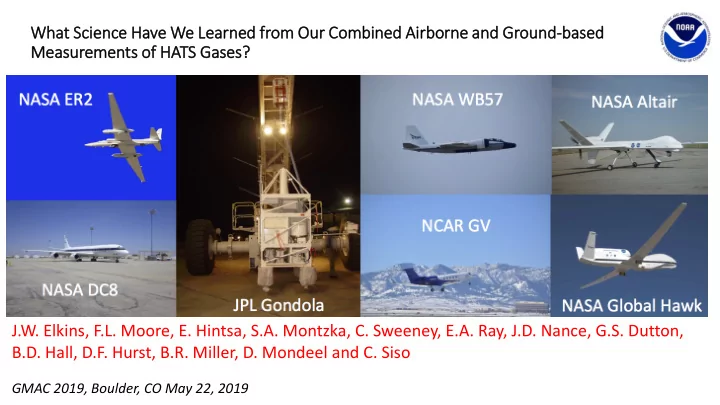
What S t Scien ence H e Have W e We Learned ed f from O Our C Combined ed A Airborne e and G Ground-based ed Measurem emen ents o of H HATS G Gases es? J.W. Elkins, F.L. Moore, E. Hintsa, S.A. Montzka, C. Sweeney, E.A. Ray, J.D.
HATS network data available at ftp://ftp.cmdl.noaa.gov/hats All Atom data are available publicly at the NASA ORNL DAAC https://daac.ornl.gov/ATOM/campaign/