
SLIDE 1
What Makes a Good Economic Capital Model? Economic Capital Model? - - PowerPoint PPT Presentation
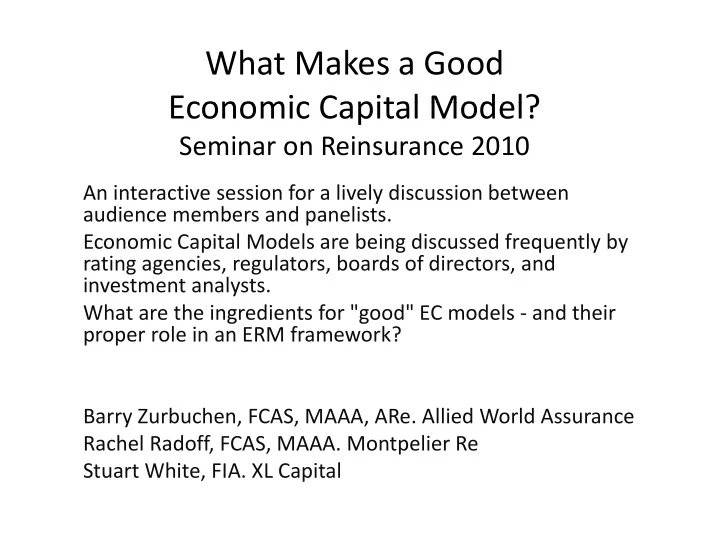
What Makes a Good Economic Capital Model? Economic Capital Model? Seminar on Reinsurance 2010 An interactive session for a lively discussion between audience members and panelists. Economic Capital Models are being discussed frequently by Economic
The Casualty Actuarial Society is committed to adhering strictly
Under no circumstances shall CAS seminars be used as a means
It is the responsibility of all seminar participants to be aware of
a) Reserve risk a) Reserve risk b) One year vs. ultimate c) Investment risk d) Bad debt risk e) Shock & Attritional f) Correlations g) Catastrophe h) O ti l Ri k h) Operational Risk
http://www croforum org/assets/files/publications/croforum internalmodeladmissibility april2009 final pdf http://www.croforum.org/assets/files/publications/croforum_internalmodeladmissibility_april2009_final.pdf
consistent manner. They should adopt modeling techniques and approaches appropriate to the consistent manner. They should adopt modeling techniques and approaches appropriate to the nature, scale and complexity of the business.
the organization and the model’s purpose.
The insurer should document the governance
methodology and assumptions underlying the internal model and its development. Internal model results should be traceable and auditable.
methodologies and results, are fully embedded into the financial and risk strategy and operational processes of the insurer processes of the insurer.
place with respect to the internal model.
independent review ‐ internal or external depending on materiality ‐ to validate the appropriateness of the model and be able to demonstrate that the model remains fit for purpose in appropriateness of the model and be able to demonstrate that the model remains fit for purpose in changing circumstances.
From CRO Forum Internal Model Admissibility
Planning Mgmnt Reporting Pricing
Rating Agencies Reinsurance Optimization Board Reporting
Capital Mgmnt
ORSA Regulators
ECM
ERM
Parameterization
Insurance Risk UW Risk Reserve Risk Operational Risk Investment Risk Market Risk Counterparty Default UW Cycle Correlation Ceded Liquidity Debt Investment Expense Cat Shock
FX Property
Default Ceded Parameter Risk UW Expense FX Dividends Correlation Parameter Risk Attritional
p y Equity Spread
Stress Test Back Test Scenarios Sensitivity Test
Spread Concentration Model Risk Timing Risk Risk Margin Management Action Reputation Risk Contagion
Documentation y Validate Use Test
Interest Rate
Documentation
– How well does the reserve predicted by the model match the held reserve? If no, then can you trust the predicted standard deviation as well? – Do relationships across lines make sense? – Back‐testing – Compare historical prior year development to model predictions – Changes to the mix of business or terms and conditions. May need to adjust the data or bear in mind when selecting results – Plot the output of model iterations (rather than just taking mean and standard deviation) – Benefit of fitting a distribution to simulated model output ‐ more stable tail values
– Plot residuals – do they match assumed distributions? – Variance or Heteroskedasticity (can be a problem across development periods or underwriting years) Variance or Heteroskedasticity (can be a problem across development periods or underwriting years) – Outliers – Leverage – identify points with excessive influence on model results – Significance tests of model parameters – Compare goodness of fit with historical data – Compare goodness of fit with historical data
80% confidence interval
Line B Line A
1-in-4-years strengthening 1-in-3-years release
Line D Line C
1-in-2-years strengthening 1-in-7-years release
0% 10% 20% 30% 40% 50% 60% 70% 80% 90% 100% Line F Line E
1-in-2-years release 1-in-2-years strengthening
Percentiles
A back‐test compares reserve development over a one‐year period against the original estimate of a reserve range In this exhibit red indicates a strengthening of reserves, green a release
is insufficient to cover the full run off of the liabilities” is insufficient to cover the full run‐off of the liabilities
R l i h d h i
– Complete run‐off of liabilities under the Solvency II regime is satisfied by additionally holding the present value of the cost of future one‐year capital requirements to run‐off the liabilities,
distributions is more complex than it is for the ultimate perspective:
– A one‐year method needs to re‐estimate the claims reserve at the end of the time period, using the new information gained
1 Simulate the completion of Ultimate Risk Model Claims data Stochastic j ti f Ultimate L
paid/incurred triangle
ultimate loss estimate projection of claims Loss
reserve k d l Claims data Ultim
claims 2 Apply reserving method to get One‐Year Risk Model mate Loss
an estimate of ultimate losses
Apply reserving method reserve
Th d l i ill ll h b diff f – The year end claims payments will generally have been different from those expected, and reapplying the same development factors will give rise to a new indication for the claims reserve – Secondly, the extra claims experience may also result in a different y, p y selection of development factors
* Wacek M G 2007 The Path of the Ultimate Loss Ratio Estimate Casualty Actuarial Society Forum Winter 2007 339‐370 Wacek, M.G., 2007, The Path of the Ultimate Loss Ratio Estimate. Casualty Actuarial Society Forum, Winter 2007, 339 370
Economic conditions impact assets and liabilities.
Economic
Inflation
Assets
Scenario Generator (ESG)
FX Yield Curves Equity Property GDP Etc
Assets Liabilities
Liabilities covered in reserve risk.
Investment risk can be modeled:
Etc.
Liabilities
Most non‐life insurance companies with ECM’s use an outsourced, stochastic, real‐world ESG due to the specialized expertise needed.
Real World: simulates target actual probabilities in the real world, from historical data and expert opinion. Risk Neutral: trading or pricing methodology, assumes no arbitrage opportunities.
ESG usually initially outsource parameterization / calibration; however, reinsurer may be able to overlay own t ti expectations.
Asset model based on ESG with asset parameters selected by reinsurer.
ESG: Inflation Asset Model: Interest FX Property CPI GDP Fixed Income Equities Cash Alternatives Property
Investment Risk
ESG’s can be used for:
y g g g
Areas needing improvement/research:
T il l i i k d
/ p p ( , )
Credit Risk: (1) market credit risk on invested assets (mainly corporate bonds), (2) counterparty default risk on claim reserves, and (3) funds held by intermediaries.
(1) Covered in market / investment risk. (2) Counterparty default risk largest source of bad debt for reinsurers (2) Counterparty default risk largest source of bad debt for reinsurers. (3) Usually limited for reinsurers. Counterparty Default Risk exposure on: Prior years’ ceded ultimate reserves (developed for possible future deterioration/improvement) Projected current / future year’s ultimate ceded losses Internal vs External reinsurance: Bad debt charge on internal transactions. Bad debt charge for one segment would be offset by decreased assumed loss to the segment. Methods:
( g p ) p y ( ) Loss Given Default:
bankruptcy proceedings for the intermediary holding company bankruptcy proceedings for the intermediary holding company.
Risk Charge = ∑ (if Default, 1 else 0) * LGD * Recoverable Exposure.
Where, calculated at the reinsurer level takes into account reinsurers’ exposure on both prior and current year exposures.
Probability of default function of: Probability of default function of: A. Base probability of default / downgrade B. Willingness to pay / dispute C. Economic conditions D. Industry insurance results for current year E. Industry reserve adequacy F. Duration of contract G. Contagion / domino effect / correlation H. Other
probability of default, or a transition matrix taking into account default over time, for the length of each
improperly rating?
Study, April 2008, shows relationship between real GDP growth and downgrade/upgrade ratio.
This factor may account for some contagion. We can assume our own loss levels are similar to industry (basis risk) or we can bring in industry losses (AIR/RMS.)
Example: (values are for example only) C C h AM B FSR i f A B b bili f d f l i hi 0 12%
Total probability of default for company c within one year for simulation # x: Function (base 0.12%, willingness 0.05%, economy 1.10, industry 2.0, reserves 1.0) If you assumed additive for base probability of default and willingness to pay, and multiplicative for other loads (which is purely for ease of example), then probability of default for the current simulated year is: (0.12% + 0.05%) * 1.10 * 2.0 * 1.0 = 0.374%
Other issues: Downgrade risk: bad debt charge for downgrade (not just default.) Not many people currently do this. Wh d i th i k h ? When do you recognize the risk charge?
dependence
– Joint distribution of U(0,1) variables Joint distribution of U(0,1) variables – These unit uniform variates can be viewed as probabilities from some other distribution
– Easy to work with BUT h N l l i ld i i d d – BUT, the Normal copula yields asymptotic independence
– Frank and Clayton – Also independent in upper tail – Gumbel – Tail dependence and asymmetric (more weight in right tail).
Upper tail dependence 2 2
– Heavy Right Tail Copula – High correlation in right tail, much less in left – Student t Copula – Equal dependence in both tails
– “Modelling Dependence with Copulas and Applications to Risk Management”, Embrechs, et al – “Dependence Models and the Portfolio Effect”, Mango and Sandor – “Correlation”, Thomas Struppeck – “Tails of Copulas”, Gary Venter – “Understanding Relationships Using Copulas”, Frees and Valdez
Independent Lognormal Mean 100 and CV=20% Normal Copula (0.7) Student t Copula (0.7) 100 degrees of freedom Student t Copula (0.7) 1 degree of freedom Gumbel Copula (1.8) Clayton Copula (1.8)
BUT, what are the drivers of this correlation
– Mainly due to point in pricing cycle and inflationary forces that are similar across lines – Also systematic bias in loss reserving practices Also systematic bias in loss reserving practices
underlying causes of correlation underlying causes of correlation
– Misestimation of loss trend
– Can use inflation from ESG as a proxy for loss trend » Perhaps regression fit to CPI or other inflation index » Creates a natural link to asset prices » “Variance and Covariance Due to Inflation,” David R. Clark » “Correlation and the Aggregation on Unpaid Loss Distributions,” Paul J. Brehm
– Misestimation of rate change and prior year’s loss ratios
underlying the prospective loss ratio estimate
– Can use a collective risk model approach to add parameter uncertainty and induce correlation at same time » Simulate RVs with mean one and Variance=Vi. These, in turn could be correlated. These RVs are then used to scale frequency, severity or aggregate loss distributions. Yields natural contagion across lines and geographies. » “The Aggregation and Correlation of Insurance Exposure,” Meyers, Klinker and Lalonde
the catastrophe model
– Completeness and quality of data received, and any assumptions made for incomplete data – Assumptions inherent within the catastrophe model and modifications made
The A+ student versus the B student
– Everyone has access to the catastrophe models (i.e. been to the same classes and given the same materials) – It’s the ones who make best use of it (and do their homework!) that prosper
counting counting
– Truncate catastrophe model distributions or exclude natural catastrophe losses from underwriting risk data
– Location data – varies widely by location and peril, and is typically far more granular in ‘peak zones’ y y p , yp y g p such as California earthquake or East coast windstorm – Availability of risk characteristics such as occupancy, construction – What is done when detail is lacking, what are the default or standard assumptions?
capital models capital models
– Assumptions in correlation between lines of business when applying secondary uncertainty C bi i di t ib ti f d d b th k h ki d fi f ll i – Combining distributions for damage caused by earthquake shaking and fire following – Generating secondary uncertainty distributions post Excess of Loss reinsurance
– Unmodelled pieces of modelled contracts (e.g. multi‐location contracts or business interuption) – Classes that often have significant unmodelled exposures such as retrocession or aspects of marine – Classes that often have significant unmodelled exposures such as retrocession or aspects of marine – Unmodelled elements of a modelled loss – e.g. loss expenses, storm surge or underinsurance
people, and systems or from external events…
Act to reduce it to extent mitigation efforts cost effective
– Any risk that is not otherwise modeled – Examples:
– Need to first identify all such risks of the company
Insurance Companies” GIRO Working Party Insurance Companies , GIRO Working Party
– Exposure Related
g
– Loss‐Related
l d – Cause Related
Hours of overtime per employee
– Does not require strict estimation of associated probabilities – Useful method for thinking about operational risk
E g lack of controls on reserving: – E.g. lack of controls on reserving:
– E.g. economic downturn leads to operational risks and impacts asset values and insurance liabilities
– Operational risk losses extremely skewed – Traditional statistical techniques do not work well – EVT focuses on tail – severity of loss given that it exceeds threshold
May have internal data but certainly not enough to parameterize tail of distribution – May have internal data, but certainly not enough to parameterize tail of distribution
– “Quantifying Regulatory Capital for Operational Risk”, Embrechts, Furrer and Kaufmann
– External data
– Requires some measure of exposure q p
– Applicability to an insurance enterprise
Publications / Resources:
“Internal Models Benchmarking Study Summary Results” CRO Forum Internal Models Benchmarking Study Summary Results , CRO Forum http://www.croforum.org/assets/files/publications/crofintmodelbms30jan09.pdf “Benchmarking Study of Internal Models”, CRO Forum http://www.vif.ac.at/filipovic/PAPERS/BMSReportfinal.pdf “Internal Model Admissibility: Principles and Criteria for Internal Models”, CRO Forum http://www.croforum.org/publication/internal_model_admissibility/ “The Ultimate and One‐Year Views of Reserving Risk with Respect to Solvency and Risk Margins”, by Andrzej Czernuszewicz. GIRO Conference. “S l II N Lif M d li I C l l i E i C i l U d S l II” b J h Ch l d A d G GIRO C f “Solvency II Non‐Life Modeling Issues: Calculating Economic Capital Under Solvency II”, by John Charles and Andrew Gray. GIRO Conference “Integrating Reserve Risk Models into Economic Capital Models”, by Stuart White. CLRS Conference. “Reserving risk, risk margins and solvency: Re‐tuning your mind”, by Peter England. EMB http://www.solvency‐2.com/Solvency‐2/PDF/EMB%20Briefings scr%20risk%20margins.pdf http://www.solvency 2.com/Solvency 2/PDF/EMB%20Briefings_scr%20risk%20margins.pdf
http://www.lloyds.com/Lloyds_Market/Solvency_II/ “Principle‐Based Risk Management to Solvency Requirements.” SCOR. http://www.scor.fr/www/index.php?id=433&L=2 “Presentation to Investors and Analysts on Capital Management.” Royal & SunAlliance. http://www.rsagroup.com/rsa/uploads/reports/FinalCapitalDaypresentation.pdf
Publications / Resources:
“Specialty Guide on Economic Capital”, by the EC Subgroup of the SOA RMTF htt // tf / tf ht l http://rmtf.soa.org/rmtf_ecca.html “Economic Scenario Generation for Financial Institutions”, by Tony Dardis http://www.soa.org/library/content/cc/mtg‐2009‐econ‐scenario.pdf “Simulation Modeling: Pitfalls and Best Practices”, by Tom Hettinger http://www.casact.org/education/reinsure/2009/handouts/CS13‐hettinger.pdf http://www.casact.org/education/reinsure/2009/handouts/CS13 hettinger.pdf “Actuarial Aspects of Internal Models for Solvency II”, by Brooks et al. FSA. http://www.actuaries.org.uk/__data/assets/pdf_file/0009/146664/sm20090223.pdf “Practical Implementation Challenges of Internal Models under Solvency II”, by Austin et al. SIAS (Staple Inn Actuarial Society) “Economic Capital Modeling: Practical Considerations”, by Finkelstein et al. Milliman. http://europe.milliman.com/perspective/special‐reports/pdfs/economic‐capital‐modeling‐practical‐SR14‐12‐06.pdf “Insurance Risk Study: Modeling the Global Market.” Aon Benfield “Economic Scenario Generators and Solvency II”, by E.M. Varnell. Institute of Actuaries http://www actuaries org uk/ data/assets/pdf file/0015/162150/sm20091123 pdf http://www.actuaries.org.uk/__data/assets/pdf_file/0015/162150/sm20091123.pdf “Practical issues in ALM and Stochastic modeling for actuaries”, by MacNamara and Gibbs. Institute of Actuaries http://www.actuaries.asn.au/IAA/upload/public/1.b_Conv07_Paper__Gibbs%20McNamara_Practical%20Applications%20in%20ALM.pdf “The Modeling of Reinsurance Credit Risk”, by R.A.Shaw. GIRO Conference. http://www.actuaries.org.uk/?a=127497 “Two Approaches to Calculating Correlated Reserve Indications Across Multiple Lines of Business”, by Kirschner, Kerley and Isaacs http://www.actuaries.org.uk/__data/assets/pdf_file/0006/18717/Kirschner.pdf