what is vascular quality today
play

What is Vascular Quality Today? Depends on Measurement Method ACS - PowerPoint PPT Presentation

4/18/2013 What is Vascular Quality Today? Depends on Measurement Method ACS National Surgery Quality Improvement Program (NSQIP) Vascular Quality Today NSQIP, University Hospital Consortium (UHC) UHC, and SVS/VQI at Stanford


  1. 4/18/2013 What is Vascular Quality Today? Depends on Measurement Method… • 
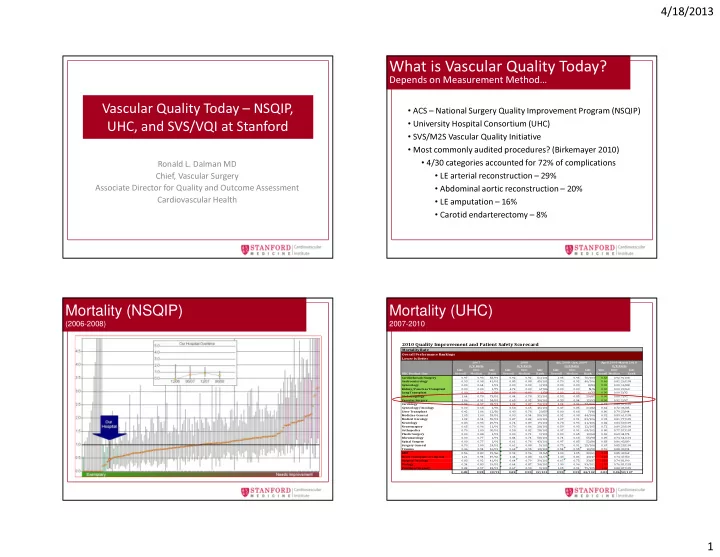
ACS – National Surgery Quality Improvement Program (NSQIP) Vascular Quality Today – NSQIP, • University Hospital Consortium (UHC) UHC, and SVS/VQI at Stanford • SVS/M2S Vascular Quality Initiative • Most commonly audited procedures? (Birkemayer 2010) • 4/30 categories accounted for 72% of complications Ronald L. Dalman MD • LE arterial reconstruction – 29% Chief, Vascular Surgery • Abdominal aortic reconstruction – 20% Associate Director for Quality and Outcome Assessment • LE amputation – 16% Cardiovascular Health • Carotid endarterectomy – 8% Mortality (NSQIP) Mortality (UHC) (2006-2008) 2007-2010 2010 Quality Improvement and Patient Safety Scorecard Mortality Rate Overall Performance Rankings Lower Is Better 2007 2008 Jul, 2008 - Jun, 2009 April 2009-March 2010 O/E Ratio O/E Ratio O/E Ratio O/E Ratio SHC UHC SHC SHC UHC SHC SHC UHC SHC SHC UHC SHC UHC Product Line Overall Median Rank Overall Median Rank Overall Median Rank Overall Median Rank Cardiothoracic Surgery 0.97 0.93 55/91 0.92 0.92 51/101 1.05 0.95 70/103 0.58 0.92 9/108 Gastroenterology 0.93 0.98 41/91 0.85 0.88 45/101 0.79 0.92 40/106 0.66 0.81 26/109 Gynecology 0.00 0.64 1/91 0.00 0.00 1/101 0.00 0.00 8/84 0.00 0.00 16/88 Kidney/Pancreas Transplant 0.00 0.00 1/79 4.72 0.00 67/86 0.00 0.00 N/A 0.00 0.00 23/60 Lung Transplant 0.00 0.00 1/38 0.00 0.00 1/38 0.00 0.00 6/33 0.00 0.00 5/32 Otolaryngology 1.64 0.70 73/91 0.44 0.78 32/101 0.53 0.85 29/87 0.00 0.66 7/91 Vascular Surgery 1.06 0.91 54/91 0.65 0.92 30/101 0.33 0.94 12/93 0.00 0.92 2/97 Cardiology 0.92 0.97 33/91 1.02 0.87 74/101 1.02 0.91 77/106 0.73 0.83 37/109 Gynecology/Oncology 0.00 0.68 1/96 0.58 0.65 45/101 0.47 0.85 21/82 0.62 0.72 36/85 Liver Transplant 0.42 1.06 12/56 0.43 0.78 20/59 0.00 0.68 7/46 0.80 0.79 23/44 Medicine General 1.05 1.00 53/91 0.93 0.94 50/101 0.92 0.98 44/106 0.92 0.89 61/109 Medical Oncology 1.02 0.94 59/91 0.87 0.82 63/101 1.07 0.91 81/106 0.95 0.81 77/109 Neurology 0.83 0.93 29/91 0.74 0.89 19/101 0.78 0.93 21/106 0.82 0.84 50/109 Neurosurgery 0.65 0.96 11/91 0.70 0.86 28/101 0.59 0.93 12/105 0.72 0.89 29/109 Orthopedics 0.79 1.00 30/91 0.58 0.82 28/101 0.97 0.91 63/102 0.80 0.77 57/107 Plastic Surgery 0.00 0.88 1/91 0.00 0.71 1/101 0.00 0.65 10/68 0.69 0.63 44/74 Rheumatology 0.00 0.77 1/91 0.84 0.74 58/101 0.74 0.68 55/98 0.89 0.74 64/101 Spinal Surgery 0.00 0.77 1/91 0.61 0.76 43/101 0.97 0.85 52/86 0.83 0.86 43/89 Surgery General 0.79 1.00 24/91 0.61 0.88 5/101 0.75 0.91 25/106 0.67 0.85 28/109 Trauma 0.46 0.94 16/91 0.62 0.95 13/101 0.54 0.95 10/90 0.76 0.88 30/94 BMT 0.56 0.89 19/66 0.92 0.96 31/65 1.00 1.05 30/61 1.01 0.85 43/62 Heart Transplant or Implant 1.21 0.94 49/66 1.44 0.88 61/75 1.43 0.86 43/47 1.50 0.74 47/50 Surgery Oncology 0.83 0.92 41/91 0.64 0.79 39/101 0.67 0.75 33/87 1.20 0.74 81/90 Urology 0.34 0.83 19/91 0.64 0.87 34/101 1.99 0.96 93/101 1.07 0.76 81/103 Ventilator Support 0.82 0.97 23/91 0.67 0.90 9/101 1.05 0.91 79/105 1.02 0.88 87/109 0.88 0.95 30/91 0.82 0.90 32/101 0.90 0.93 44/102 0.83 0.86 50/107 1

  2. 4/18/2013 Observed/Expected(O/E) Index Trends (UHC) Vascular Performance (UHC) Current (2006-2010) Target of O/E= Under 1 11/13 quarters showed an O/E rate of under 1; the last three quarters are also under the desired target. • Division = Discharge MD Division • Data Source: University Healthcare Consortium (UHC) 5 6 CVH Produce Line (UHC) Current CVH Core Measures Current 7 8 2

  3. 4/18/2013 Individual Process/Outcome Score Individual “Score” What is “Value” in Health Care? Public Reporting (stanfordhospital.org/cardiovascularhealth) 3

  4. 4/18/2013 SVS Vascular Quality Initiative (VQI) SVS Vascular Quality Initiative (VQI) Total Procedures Captured 80,861 (as of February 28, 2013) Carotid Endarterectomy 22,247 Carotid Artery Stent 2,835 Endovascular AAA Repair 8,295 Open AAA Repair 3,694 23,955 Peripheral Vascular Intervention Infra-Inguinal Bypass 11,780 Supra-Inguinal Bypass 3,443 Thoracic and Complex EVAR 965 224 Centers, 44 States + Ontario as of 3/1/2013 Hemodialysis Access 3,210 SVS Vascular Quality Initiative (VQI) SVS Vascular Quality Initiative (VQI) Wound Infection Rate after Infra-Inguinal Bypass Procedure Observed and Expected by Centers 4,081 patient procedures, January 2010 December 2012 Observed Expected 36% 32% 28% 24% 20% 16% 12% 8% 4% 0% ** ** ** ** ** ** ** VQI Centers Significantly higher than expected : Overall rate Wound Infection * p<0.05 VQI = 3.6% adjusted for: skin preperation, ankle/brachial systolic pressure index, AUC = 0.65 **p<0.01 transfusion, length of procedure 4

  5. 4/18/2013 SVS Vascular Quality Initiative (VQI) SVS Vascular Quality Initiative (VQI) Organized Regional Groups: Elective Endo AAA Repair - VSGNNE New England January 2003 - December 2007: Region, N=701 (blue) and DHMC, N=285 (red) Carolinas Use of Beta-Blockers Use of Aspirin or Plavix Use of Statins Volume Florida-Georgia 100 100 100 180 Southern California 160 80 80 80 Number of procedures 140 South 120 Percent 60 Percent 60 Percent 60 100 Virginias 40 40 40 80 90% benchmark (dashed line) established November 2003 95% benchmark (dashed line) established November 2006 60 B-blocker working group presentations May 2004 New York City 20 20 20 40 20 Rocky Mountains 0 0 0 0 2003 2004 2005 2006 Jan-Jun Jul-Dec 2003 2004 2005 2006 Jan-Jun Jul-Dec 2003 2004 2005 2006 Jan-Jun Jul-Dec 07 07 07 07 07 07 2003 2004 2005 2006 2007 Illinois Unfit for Open Repair Any Endoleak at Completion Type I or III Endoleak Estimated Median Blood Loss Wisconsin 60 70 700 650 Mid-Atlantic 60 50 10 600 550 50 Upstate New York 40 500 Millimeters 450 Percent 40 Percent Percent 400 30 350 Chesapeake Valley 30 300 5 20 250 20 200 Indiana 150 10 10 100 50 Ohio 0 0 0 0 2003 2004 2005 2006 Jan-Jun Jul-Dec 2003 2004 2005 2006 Jan-Jun Jul-Dec 2003 2004 2005 2006 Jan-Jun Jul-Dec 2003 2004 2005 2006 Jan-Jun Jul-Dec 07 07 07 07 07 07 07 07 Organizing Regional Groups: Not Extubated in Operating Room Post-operative Complications Not Discharged Home Mortality Northern California 60 35 7 20 Bleeding, MI, dysrhythmia, CHF, respiratory, change of renal function, leg ischemia/emboli, bowel ischemia, Among those who came from home 18 50 30 6 wound complication or return to operating room Michigan 16 25 5 14 40 Missouri Percent 12 Percent Percent 20 Percent 4 30 10 15 3 Tennessee/Mississippi 8 20 6 10 2 15 Regional Quality Groups Minnesota 4 10 5 1 2 0 0 0 0 2003 2004 2005 2006 Jan-Jun Jul-Dec 2003 2004 2005 2006 Jan-Jun Jul-Dec 2003 2004 2005 2006 Jan-Jun Jul-Dec 2003 2004 2005 2006 Jan-Jun Jul-Dec 07 07 07 07 07 07 07 07 Lessons Learned Year 1 VQI 1. Energy of activation is high – maximize momentum 2. Hospital must embrace/finance/maintain VQI 3. Work within existing Quality format – ACC/STS/VQI 4. EMR programming to maximize data capture 5. Workflow paramount: NPS/MA/NPs/MD 6. Weekly sweep of incomplete procedures 7. Introduce incentives to maximize compliance/capture 8. Regional framework essential to long term success 5

  6. 4/18/2013 Future of NorCal Vascular? Future of NorCal Vascular? Vascular Faculty and Residents 2013 2012 Pac 12 & 2013 Rose Bowl Champions 6

  7. 4/18/2013 NSQIP Performance Current The Odds Ratio column shows that Vascular performance has been under target of 1 in majority of the categories. Area of highest improvement= AAA Pneumonia 7

  8. 4/18/2013 Disclosures Carolus Exelixis Genentech Medtronic Pfizer Novartis WL Gore Medtronic Cook Medical Vascular Surgery wRVUs 2005-2012 40,000 35,572 33,219 35,000 32,621 27,789 30,000 26,015 23,491 25,000 20,447 20,091 20,000 15,000 10,000 5,000 0 FY2005 FY2006 FY2007 FY2008 FY2009 FY2010 FY2011 FY2012 8

Download Presentation
Download Policy: The content available on the website is offered to you 'AS IS' for your personal information and use only. It cannot be commercialized, licensed, or distributed on other websites without prior consent from the author. To download a presentation, simply click this link. If you encounter any difficulties during the download process, it's possible that the publisher has removed the file from their server.

Recommend


More recommend