What is New in Addiction? New Findings on The Course of Recovery - - PowerPoint PPT Presentation

what is new in addiction new findings on the course of
SMART_READER_LITE
LIVE PREVIEW

What is New in Addiction? New Findings on The Course of Recovery - - PowerPoint PPT Presentation

What is New in Addiction? New Findings on The Course of Recovery from Alcohol and Drug Problems in the U.S. MGH Psychopharmacology Conference OCTOBER 2020 John F. Kelly, PhD, ABPP www.mghcme.org Disclosures Neither I nor my spouse/partner


slide-1
SLIDE 1

www.mghcme.org

MGH Psychopharmacology Conference OCTOBER 2020 John F. Kelly, PhD, ABPP

What is New in Addiction? New Findings on The Course

  • f Recovery from Alcohol and

Drug Problems in the U.S.

slide-2
SLIDE 2

www.mghcme.org

Disclosures

Neither I nor my spouse/partner has a relevant financial relationship with a commercial interest to disclose.

slide-3
SLIDE 3

Outline

Why long-term remission/recovery important? National Recovery Study What is the prevalence of alcohol

  • r other drug

problem resolution? What proportion self- identify as being “in recovery”? What are the pathways followed? How many serious attempts does it take to resolve AOD problems? What is quality of life and functioning like in recovery?

slide-4
SLIDE 4

Outline

Why long-term remission/recovery important? National Recovery Study What is the prevalence of alcohol

  • r other drug

problem resolution? What proportion self- identify as being “in recovery”? What are the pathways followed? How many serious attempts does it take to resolve AOD problems? What is quality of life and functioning like in recovery?

slide-5
SLIDE 5

1970

During the past 50 yrs since “War on Drugs” declared, we have moved from “Public Enemy No. 1” to “Public Health Problem No. 1”

slide-6
SLIDE 6
slide-7
SLIDE 7

With 5% of the world’s pop, the US has 25% of its prisoners. Avg US cost per prison inmate = (2010) = $31K (range 14K-60K); about $16 Billion for the 500,000 drug-related prisoners (20% of all prisoners)

slide-8
SLIDE 8

Prisons overcrowding: 20% (500,000) of US prisoners are in prison due to drug

  • ffences
  • Photo: California Department of Corrections
slide-9
SLIDE 9

Laws passed in the past 50 yrs have moved from more punitive ones to public health oriented ones…. increasing availability, accessibility and affordability of treatment..

slide-10
SLIDE 10

2013 ONDCP Director Kerlikowske declares move away from “war on drugs” toward broader public health approach

slide-11
SLIDE 11

War on drugs War on the war on drugs BUT… not just about interdiction, supply reduction, incarceration…. Also, a great deal carried out on the demand reduction side…

slide-12
SLIDE 12

The “war on drugs” was part of a national concerted effort to reduce “supply” but also “demand” that created treatment and public health oriented federal agencies..

slide-13
SLIDE 13

Paradigm Shifts

slide-14
SLIDE 14

www.mghcme.org

Genetics, Genomics, Pharmacogenetics

slide-15
SLIDE 15

www.mghcme.org

Neuroscience: Neural plasticity

slide-16
SLIDE 16
slide-17
SLIDE 17

“Quitting smoking is easy, I’ve done it dozens of times” –Mark Twain

slide-18
SLIDE 18

www.mghcme.org

What people really need is a good listening to…

slide-19
SLIDE 19

www.mghcme.org

Swift, certain, modest, consequences shape behavioral choices…

slide-20
SLIDE 20

www.mghcme.org

Effective Medications

slide-21
SLIDE 21

www.mghcme.org

Harm Reduction Strategies

  • Anti-craving/anti-relapse medications (“MAT”)
  • Overdose reversal medications (Narcan)
  • Needle exchange programs
  • Heroin prescribing
  • Safe Injection Facilities/Safe Consumption sites/Overdose

prevention facilities

slide-22
SLIDE 22

www.mghcme.org

slide-23
SLIDE 23

www.mghcme.org

The clinical course of addiction and achievement of stable recovery can take a long time …

slide-24
SLIDE 24

1st Surgeon General’s Report on Alcohol, Drugs, and Health 2016

slide-25
SLIDE 25

www.mghcme.org

Focus on Recovery

  • Bill White for decades has talked about

understanding more about recovery from the tens

  • f millions already in recovery-untapped resource.
  • Whole libraries/volumes written about etiology,

epidemiology, and treatment, but little about recovery…

  • A lot might be learned from the millions of people

already successfully in long-term recovery; how they did it; what helped, made the difference.

slide-26
SLIDE 26

Outline

Why long-term remission/recovery important? National Recovery Study What is the prevalence of alcohol

  • r other drug

problem resolution? What proportion self- identify as being “in recovery”? What are the pathways followed? How many serious attempts does it take to resolve AOD problems? What is quality of life and functioning like in recovery?

slide-27
SLIDE 27

National Recovery Study (NRS)

  • Designed to:
  • Estimate national “recovery” prevalence using

nationally-representative, probability-based, sample

  • f individuals who self-report once having a

problem with AODs but no longer do…

  • Uncover and discover more about chosen recovery

pathways and their correlates

  • Estimate number of serious quit attempts prior to

problem resolution

  • Investigate relationships between duration of

recovery and changes in other health behaviors (e.g. smoking cessation) indices of functioning and quality of life

slide-28
SLIDE 28
slide-29
SLIDE 29

Sample Weighting Weights were computed via comparisons to benchmarks from the March 2015 Current Population Survey (CPS; United States Census Bureau, 2015)along eight dimensions..

(1) gender (male/female) (2) age (18–29, 30–44, 45–59, and 60+ years) (3) race/Hispanic ethnicity (White/Non- Hispanic, Black/Non- Hispanic, Other/Non- Hispanic, 2+ Races/Non- Hispanic, Hispanic) (4) education (Less than High School, High School, Some College, Bachelor and beyond) (5) census geographical region (Northeast, Midwest, South, West) (6) household income (under $10k, $10K to <$25k, $25K to <$50k, $50K to <$75k, $75+) (7) home ownership status (Own, Rent/Other); and (8) metropolitan area (yes/no).

slide-30
SLIDE 30

www.mghcme.org

Response rate similar to other national epidemiological surveys

  • This response rate is comparable to most other current nationally

representative surveys

  • NESARC-III; 60.1% (Grant et al., 2015)
  • 2015 National Survey on Drug Use and Health (NSDUH; 58.3%;

Center for Behavioral Health Statistics and Quality, 2016)

  • 2013-2014 National Health and Nutrition Examination Survey

(NHANES; 68.5%; Centers for Disease Control and Prevention [CDC], 2013).

  • Data were weighted to accurately represent the civilian population

using the method of iterative proportional fitting, which is commonly referred to as “raking” (Battaglia, Hoaglin, & Frankel, 2013).

slide-31
SLIDE 31

www.mghcme.org

MEASURES

– Demographic characteristics – Substance Use History – Medical History – Criminal Justice History – Treatment and Other Recovery Support Services – Problem Resolution/Recovery History – Recovery Capital – Psychological Distress – Quality of Life – Happiness – Self-Esteem

slide-32
SLIDE 32

Outline

Why long-term remission/recovery important? National Recovery Study What is the prevalence of alcohol

  • r other drug

problem resolution? What proportion self- identify as being “in recovery”? What are the pathways followed? How many serious attempts does it take to resolve AOD problems? What is quality of life and functioning like in recovery?

slide-33
SLIDE 33

www.mghcme.org

slide-34
SLIDE 34
slide-35
SLIDE 35

www.mghcme.org

Alcohol 59% Cannabis 13% Cocaine 11% Methamphetamine 8% Opioids 6% Other 3%

Primary Substance

Alcohol Cannabis Cocaine Methamphetamine Opioids Other

slide-36
SLIDE 36

Outline

Why long-term remission/recovery important? National Recovery Study What is the prevalence of alcohol

  • r other drug

problem resolution? What proportion self- identify as being “in recovery”? What are the pathways followed? How many serious attempts does it take to resolve AOD problems? What is quality of life and functioning like in recovery?

slide-37
SLIDE 37
slide-38
SLIDE 38

Proportion self-identify as being “in recovery”

46%

  • Odds of self-identifying in this manner

associated with greater indices of greater severity (earlier age of onset, psychiatric comorbidities, greater treatment and recovery support services use)

slide-39
SLIDE 39

Outline

Why long-term remission/recovery important? National Recovery Study What is the prevalence of alcohol

  • r other drug

problem resolution? What proportion self- identify as being “in recovery”? What are the pathways followed? How many serious attempts does it take to resolve AOD problems? What is quality of life and functioning like in recovery?

slide-40
SLIDE 40

www.mghcme.org

MULTIPLE PATHWAYS TO RECOVERY

Acknowledges myriad ways in which individuals can recover: Clinical pathways (provided by a clinician or other medical professional – both medication and psychosocial interventions) Non-clinical pathways (services not involving clinicians like AA) Self-management pathways (recovery change processes that involve no formal services, sometimes referred to as “natural recovery”).

slide-41
SLIDE 41

Assisted 54% Unassisted 46%

Recovery Pathways: Assisted vs Unassisted

Assisted Unassisted

slide-42
SLIDE 42

Formal Treatment 27% Medications 9% Recovery Support Services 21% Mutual-Help 43%

Assisted Pathway: Services Used

Formal Treatment Medications Recovery Support Services Mutual-Help

slide-43
SLIDE 43

www.mghcme.org

slide-44
SLIDE 44

www.mghcme.org

slide-45
SLIDE 45

www.mghcme.org

slide-46
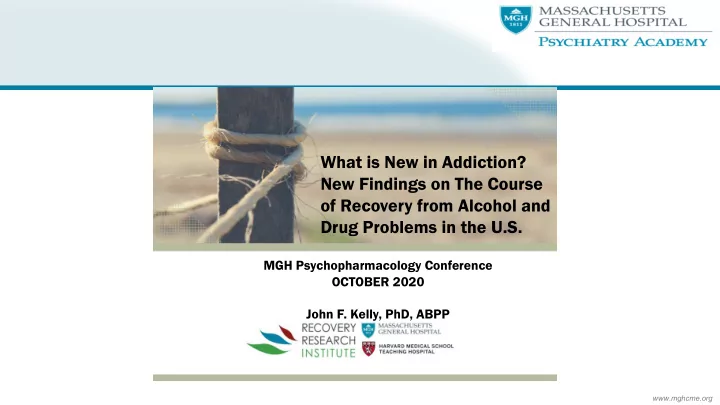
SLIDE 46

$12,129 $7,400 $5,735 $2,440 $17,864 $9,840 $0 $2,000 $4,000 $6,000 $8,000 $10,000 $12,000 $14,000 $16,000 $18,000 $20,000 CBT TSF Year 1 Year 2 Total

HEALTH CARE COST OFFSET CBT VS 12-STEP RESIDENTIAL TREATMENT

Compared to CBT-treated patients, 12-step treated patients more likely to be abstinent, at a $8,000 lower cost per pt over 2 yrs (potential $15 billion total savings for AUD patients nationally)

Also, higher remission rates, means decreased disease and deaths, increased quality of life for sufferers and their families

slide-47
SLIDE 47

www.mghcme.org

TSF often produces significantly better outcomes relative to active comparison conditions (e.g., CBT) Although TSF is not “AA”, it’s beneficial effect is explained by AA involvement post-treatment.

slide-48
SLIDE 48

www.mghcme.org

TSF-AA-OUTCOME Causal chain supported…

TSF AA BETTER OUTCOME

slide-49
SLIDE 49

www.mghcme.org

What about support for causal chain of purported mobc of AA on outcomes?

TSF AA BETTER OUTCOME MOBC?

slide-50
SLIDE 50

www.mghcme.org

Empirically-supported MOBCs through which AA confers benefit

slide-51
SLIDE 51

Outline

Why long-term remission/recovery important? National Recovery Study What is the prevalence of alcohol

  • r other drug

problem resolution? What proportion self- identify as being “in recovery”? What are the pathways followed? How many serious attempts does it take to resolve AOD problems? What is quality of life and functioning like in recovery?

slide-52
SLIDE 52

www.mghcme.org

Frequency Distribution of Serious Recovery Attempts Prior to Successful Resolution (LEFT: Full sample RIGHT PANEL: Outliers removed)

500 1000 1500

Frequency

20 40 60 80 100

Number of quit attempts

200 400 600

Frequency

2 4 6 8 10

Number of quit attempts (truncated)

slide-53
SLIDE 53

www.mghcme.org

Frequency Distribution of Serious Recovery Attempts Prior to Successful Resolution (LEFT: Full sample RIGHT PANEL: Outliers removed)

500 1000 1500

Frequency

20 40 60 80 100

Number of quit attempts

200 400 600

Frequency

2 4 6 8 10

Number of quit attempts (truncated)

Skewness=5.89, SE=0.57; Kurtosis=50.27, SE=9.66

slide-54
SLIDE 54

www.mghcme.org

Frequency Distribution of Serious Recovery Attempts Prior to Successful Resolution (LEFT: Full sample RIGHT PANEL: Outliers removed)

500 1000 1500

Frequency

20 40 60 80 100

Number of quit attempts

200 400 600

Frequency

2 4 6 8 10

Number of quit attempts (truncated)

Mean Median Full Sample 5.35 (13.41) 2 (1, 4)

slide-55
SLIDE 55

www.mghcme.org

Median Recovery Attempts by Primary Drug

2 4 6 8 10

Number of quit attempts

Alcohol Cannabis Opioids Stimulants Other Drugs

excludes outside values

slide-56
SLIDE 56

www.mghcme.org

Number of Recovery Attempts by Clinical and Recovery Support Services Use

2 4 6 8 10

Number of quit attempts

No Yes

excludes outside values

Depression

2 4 6 8 10

Number of quit attempts

No Yes

excludes outside values

Anxiety

2 4 6 8 10

Number of quit attempts

No Yes

excludes outside values

Outpatient Treatment

5 10 15

Number of quit attempts

No Yes

excludes outside values

Inpatient Treatment

2 4 6 8 10

Number of quit attempts

Never Former Past 3-Mo

excludes outside values

Mutual-Help Attendance

2 4 6 8 10

Number of quit attempts

No Yes

excludes outside values

Any Treatment/Recovery Services

slide-57
SLIDE 57

Outline

Why long-term remission/recovery important? National Recovery Study What is the prevalence of alcohol

  • r other drug

problem resolution? What proportion self- identify as being “in recovery”? What are the pathways followed? How many serious attempts does it take to resolve AOD problems? What is quality of life and functioning like in recovery?

slide-58
SLIDE 58

www.mghcme.org

slide-59
SLIDE 59

www.mghcme.org

slide-60
SLIDE 60

www.mghcme.org

slide-61
SLIDE 61

Traditional addiction treatment approach: Burning building analogy

  • Putting out the fire -good job
  • Preventing it from re-igniting

(RP) - less emphasis

  • Architectural planning

(recovery plan) –neglected

  • Re-building materials

(recovery capital) –neglected

  • Granting “rebuilding

permits” - (removing barriers)

slide-62
SLIDE 62

www.mghcme.org

  • .4
  • .2

.2 .4 Recovery Index Z-score 1 2 3 4 5 Years Since AOD Problem Resolved

Years 0-5

  • .2
  • .1

.1 .2 Recovery Index Z-score .5 1 1.5 2 Years Since AOD Problem Resolved

Years 0-2

Recovery Indices by Years Since Problem Resolution

Quality of Life Psychological Distress Happiness Self Esteem Recovery Capital

slide-63
SLIDE 63

www.mghcme.org

slide-64
SLIDE 64

www.mghcme.org

slide-65
SLIDE 65

www.mghcme.org

Comfort disclosing recovery status: Compared to other primary substances, opioid group had the most difficult time disclosing…

slide-66
SLIDE 66

Results Summary

9.1% or 22.35 Million Americans resolved sig. AOD prob. Only about half self-identify as “in recovery” –those with less severe histories; similar crises but greater ability to stop sans help Approximately half resolve these problems without any external assistance- related to less severity/complexity Mean problem resolution attempts is around 5.5 but this number heavily skewed; Mdn number = 2; with high variability around estimates QOL indices monotonic improvements over time, with steeper increases first 5 years, then ongoing, shallower, improvement; post “pink cloud” drop early; opioid/stimulant tougher time early on

slide-67
SLIDE 67

Implications

  • RESEARCH AND POLITICAL ADVOCACY: Estimates here similar to prior

national/regional, non probability-based estimates suggesting approximately 9.1% (20-25M) of adult Americans “in recovery”. Could learn more from this large, diverse, group; mobilize for change?

  • PUBLIC HEALTH & POLICY COMMUNICTION: Although term “recovery” used in past

estimates, only about half identify as “in recovery”. Label adoption may serve adaptive funx; qualitative analyses suggest many resolving AOD may not relate and/or

  • ppose this term; thus to engage more people public health and policy

communication efforts might include “problem resolution” in addition to “recovery”.

  • HOW TO REACH MANY NOT SEEKING SERVICES, LESSEN IMPACT: In keeping with
  • ther studies, half resolved problem without help – those with lower severity and

higher recovery capital. This large group still cause harm; how to reach/lessen impact.

  • RECOVERY NEEDS DYNAMIC, VARY BY SUBGROUP: QOL changes suggest “pink cloud”

phase end may create early challenge; 1-yr things looking rosier; continue to improve; marginalized opioid/meth groups need recovery capital/support early on

  • REASONS FOR OPTIMISM: Prior estimates of quit/recovery attempts, may be “mean”

averages, thus biased upwards (with skew); while reflective of high variability, medians should be used. These were low in non-clinical (Mdn=1) and higher in clinical (Mdn=3) samples (overall = 2 serious attempts prior to resolution; Mean=5.6; SD=13.41). Hopeful.

slide-68
SLIDE 68

www.mghcme.org

Thank you for your attention!