WETTING BEHAVIORS IN RESIN-FIBER SYSTEM T. Setoguchi 1 *, Y. Fukuhara - - PDF document

wetting behaviors in resin fiber system
SMART_READER_LITE
LIVE PREVIEW

WETTING BEHAVIORS IN RESIN-FIBER SYSTEM T. Setoguchi 1 *, Y. Fukuhara - - PDF document

18 TH INTERNATIONAL CONFERENCE ON COMPOSITE MATERIALS WETTING BEHAVIORS IN RESIN-FIBER SYSTEM T. Setoguchi 1 *, Y. Fukuhara 1 , I. Ueno 2 , S. Ogihara 2 & K. Watanabe 3 1 Div. Mechanical Engineering, Graduate School of Science and Technology,


slide-1
SLIDE 1

18TH INTERNATIONAL CONFERENCE ON COMPOSITE MATERIALS

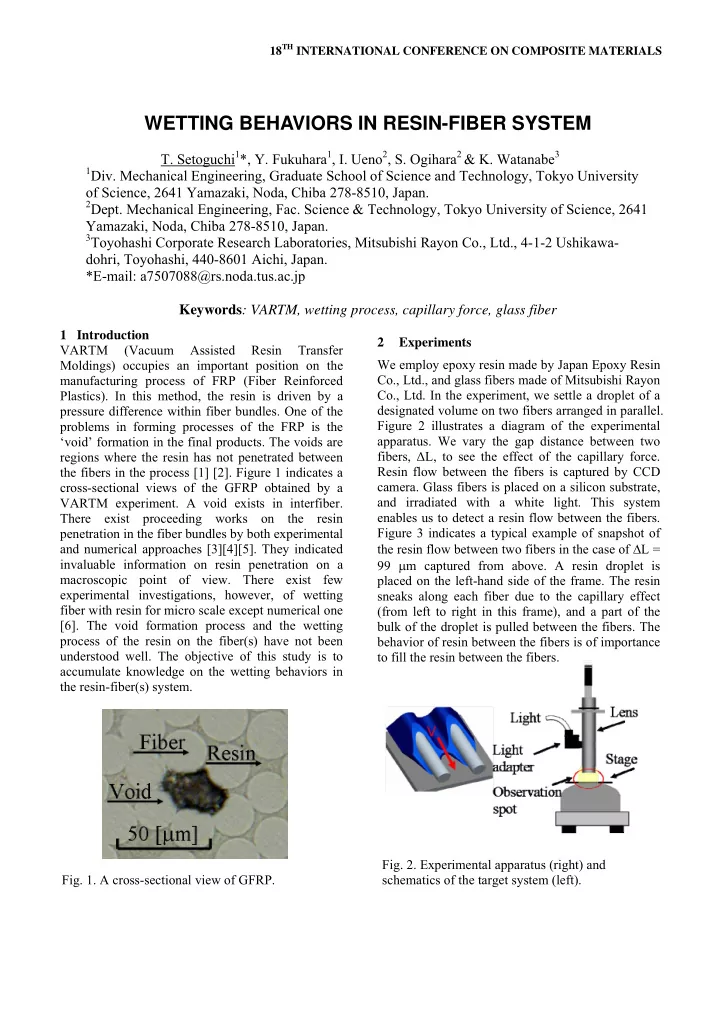
1 Introduction VARTM (Vacuum Assisted Resin Transfer Moldings) occupies an important position on the manufacturing process of FRP (Fiber Reinforced Plastics). In this method, the resin is driven by a pressure difference within fiber bundles. One of the problems in forming processes of the FRP is the ‘void’ formation in the final products. The voids are regions where the resin has not penetrated between the fibers in the process [1] [2]. Figure 1 indicates a cross-sectional views of the GFRP obtained by a VARTM experiment. A void exists in interfiber. There exist proceeding works on the resin penetration in the fiber bundles by both experimental and numerical approaches [3][4][5]. They indicated invaluable information on resin penetration on a macroscopic point of view. There exist few experimental investigations, however, of wetting fiber with resin for micro scale except numerical one [6]. The void formation process and the wetting process of the resin on the fiber(s) have not been understood well. The objective of this study is to accumulate knowledge on the wetting behaviors in the resin-fiber(s) system. 2 Experiments We employ epoxy resin made by Japan Epoxy Resin Co., Ltd., and glass fibers made of Mitsubishi Rayon Co., Ltd. In the experiment, we settle a droplet of a designated volume on two fibers arranged in parallel. Figure 2 illustrates a diagram of the experimental

  • apparatus. We vary the gap distance between two

fibers, ΔL, to see the effect of the capillary force. Resin flow between the fibers is captured by CCD

  • camera. Glass fibers is placed on a silicon substrate,

and irradiated with a white light. This system enables us to detect a resin flow between the fibers. Figure 3 indicates a typical example of snapshot of the resin flow between two fibers in the case of ΔL = 99 μm captured from above. A resin droplet is placed on the left-hand side of the frame. The resin sneaks along each fiber due to the capillary effect (from left to right in this frame), and a part of the bulk of the droplet is pulled between the fibers. The behavior of resin between the fibers is of importance to fill the resin between the fibers.

WETTING BEHAVIORS IN RESIN-FIBER SYSTEM

  • T. Setoguchi1*, Y. Fukuhara1, I. Ueno2, S. Ogihara2 & K. Watanabe3
  • 1Div. Mechanical Engineering, Graduate School of Science and Technology, Tokyo University
  • f Science, 2641 Yamazaki, Noda, Chiba 278-8510, Japan.
  • 2Dept. Mechanical Engineering, Fac. Science & Technology, Tokyo University of Science, 2641

Yamazaki, Noda, Chiba 278-8510, Japan.

3Toyohashi Corporate Research Laboratories, Mitsubishi Rayon Co., Ltd., 4-1-2 Ushikawa-

dohri, Toyohashi, 440-8601 Aichi, Japan. *E-mail: a7507088@rs.noda.tus.ac.jp Keywords: VARTM, wetting process, capillary force, glass fiber

  • Fig. 2. Experimental apparatus (right) and

schematics of the target system (left).

  • Fig. 1. A cross-sectional view of GFRP.
slide-2
SLIDE 2

3 Results 3-1 Wetting of resin around single fiber As a basic experiment, we examine the behavior of the resin along the fiber of 24 μm in diameter. A droplet of a designated volume is settled on the fiber. Figure 4 indicates the temporal variations the velocity of the resin tip on the substrate at different

  • temperatures. The time t = 0 corresponds to the

instance when the droplet is placed on the fiber. Dots correspond to the measured value, and lines indicate fitted curves. As time elapsed, the velocity decreases as the resin travels along the fiber. The velocity of the resin tip increases as the substrate temperature increases. Temperature coefficients of surface tension and viscosity are both negative for the present test fluid. In this case, the contribution of the surface tension is larger than of that the viscous

  • force. Figure 5 shows the temporal variations the

velocity of the resin tip on the substrate at different fiber diameter of d = 13, 17 and 24 μm. The velocity

  • f the resin tip decreases as the fiber diameter

become smaller. Capillary force works more at the tip as the fiber diameter becomes larger. 3-2 The behavior of resin between two fibers We observe that wetting behaviors of the resin between the fibers of 24 μm in diameter by the capillary force. Figure 6 presents a series of snapshots of top view of the resin flow along two fibers for different gap distance ΔL. One can clearly see there exists a significant difference in mutual behavior of the valley against the tip of the capillary

  • front. Figure 7 shows the temporal variations of the

velocity of the valley, that is, the resin between the fibers, as a function of ΔL. It is found that the resin between the fibers advances faster as the gap distance becomes narrower. Its advancing velocity has a local maximum at about ΔL = 40 μm under the present condition, and then the velocity decreases as ΔL is further decreased.

  • Fig. 3. Typical example of snapshot of the resin

flow between two fibers.

  • Fig. 4. Temporal variation of the velocity of the

resin tip on the substrate at different temperatures. The solid line is an approximation line.

  • Fig. 5. Temporal variation of the velocity of the

resin tip at different fiber diameter. The solid line is an approximation line.

  • Fig. 6. Typical example of snapshot of the resin

flow between two fibers against the gap distance ΔL.

slide-3
SLIDE 3

3-3 Resin profile in advancing along the fiber We reconstruct the profile of the resin advancing along a single fiber of 24 μm in diameter. To reconstruct the resin profile, we measure spatial variations of the thickness of the resin at a designated point by a confocal laser displacement

  • sensor. Schematic image of the scan line is shown in

Fig.8. The resin spreads in both x and y directions as the time goes by, as shown in Fig.9. Center of the fiber is located to be 0 points. It is found that the height of the intersection of the resin and the fiber (i.e, the contact line of the resin on the fiber) hardly changes even if time passes. 3-4 Resin profile in advancing along two fiber The thickness of the resin between the fibers is measured with a confocal laser displacement sensor. Schematic image of the measurement is shown in Fig.10. The observation point is the middle point between the fibers, and the valley of the bulk resin. Figure 11 indicates temporal variations of the resinous height from the edge of the valley position against the distance ΔL in the case of the fibers of 24 μm in diameter. The time t = 0 corresponds to 30 seconds later from placing the droplet on the fibers. It is found that the resinous height between the fibers becomes lower as the gap distance narrows. We show that the shape of the bulk resin depends not on the velocity but on the gap distance. The height of the bulk resin depends on time as well. The height of the bulk resin becomes lower as the time passes.

  • Fig. 7. Temporal variations of the velocity of the

resin between the fibers as a function of the gap distance ΔL. The solid line is an approximation line.

  • Fig. 9. Temporal variations of the meniscus
  • shape. The solid line is an approximation line.

The resin extends X axial direction

  • Fig. 8. Schematic image of the resin flow along a
  • fiber. (We scan the position from resin droplet

edge on 280 [μm])

  • Fig. 10. Schematic image of the resin flow

between of the fiber.

slide-4
SLIDE 4

We evaluate the resinous sectional area by the profile reconstruction. Flow rate is calculated by considering the continuity of the resin flow. Figure 12 shows temporal variations of the quantity of the tip resin flow rate and bulk resin flow rate. The flow rate in the vicinity of the resin tip hardly changes against the gap distance between the fibers, but in the bulk the flow rate of the resin increases as the gap distance between the fiber increases. Noted that the flow rate in the bulk become lager than that at the tip in the case of ΔL > 50 μm. The correlation between the flow rates result in a drastic change of the resin behavior along the fibers. 4 Concluding remarks We focus on the wetting process in the glass fiber- resin system. Wetting of fiber by capillary force is very important in the manufacturing process of FRP. In this study, we evaluate the effects of the substrate temperature and the gap distance between fibers on the resin spreading along two fibers. Flow resin of the resin is calculated by reconstructing the resin

  • shape. We illustrate the change in wetting behaviors

by comparing the flow rate at the resin tip and in the resin bulk. References

[1] N. Patel, V. Rohatgi & L. J. Lee, “Micro Scale Flow Behavior and Void Formation Mechanism During Impregnation Through a Unidirectional Stitched Fiberglass Mat,” Polymer Engineering and Science,

  • vol. 35, pp 837-851, 1995.

[2] V. Rohatgi, N. Patel & L. J. Lee, “Experimental Investigation of Flow-Induced Microvoids During Impregnation of Unidirectional Stitched Fiberglass Mat,” Polymer Engineering and Science, vol. 17, pp 161-170, 1996. [3] J. A. Acheson, P. Simacek & S. G. Advani, “The Implications of Fiber Compaction and Saturation on Fully Coupled VARTM Simulation,” Journal of Composite Material, Part A 35, pp 159-169, 2004. [4] P. B. Nedanov & S. G. Advani, “A Method to Determine 3D Permeability

  • f

Fibrous Reinforcement,” Journal of Composite Materials, vol.36, pp 241-254, 2002. [5] A. Koponen, D. Kandhai, E. Hellen, M. Alava, A. Hoekstra, M. Kataja, K. Niskanen, P. Sloot, J. Timonen, “Permeability

  • f

Three-Dimensional Random Fiber Webs”, Physical Review Letters,Vol.80, No.4, pp 716-719, 1998 [6] D. Lukas, “Wetting of a Fiber Bundle in Fibrous Structures,” Polymer Composite. vol. 24, pp 314-322, 2003.

  • Fig. 12. Evaluated resin flow rate in the vicinity
  • f the tip and in the bulk at 30 μm behind the

leading edge of valley.

  • Fig. 11. Temporal variations of the resinous

height from the edge of valley position as a function of the distance ΔL.