SLIDE 1
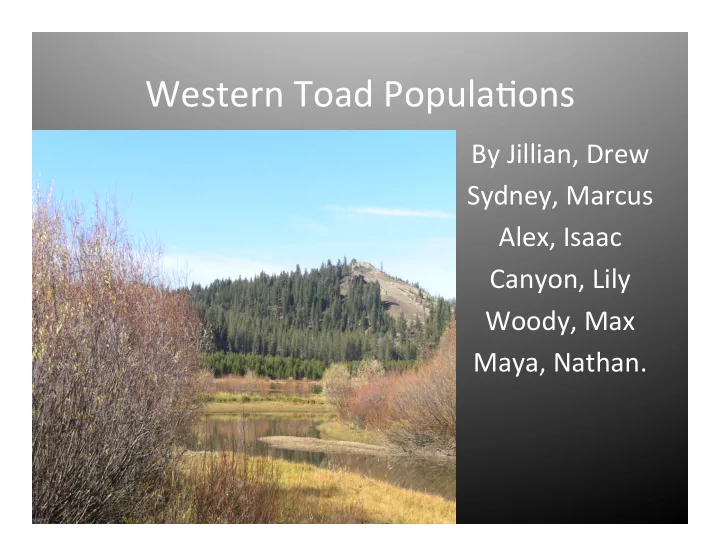
Western ¡Toad ¡Popula0ons ¡
By ¡Jillian, ¡Drew ¡ Sydney, ¡Marcus ¡ Alex, ¡Isaac ¡ Canyon, ¡Lily ¡ Woody, ¡Max ¡ Maya, ¡Nathan. ¡ ¡
SLIDE 2
Introduc0on ¡
Amphibians ¡are ¡declining ¡worldwide! ¡
Habitat ¡loss ¡ Pollutants ¡ Predators ¡
Micro-‑habitats ¡
Yuba ¡River ¡ Van ¡Norden ¡Lake ¡ Castle ¡Creek ¡ ¡
SLIDE 3
Introduc0on ¡Cont. ¡
Drought ¡is ¡decreasing ¡water ¡in ¡Van ¡Norden ¡
Missing ¡part ¡of ¡an ¡ecosystem ¡
Hypotheses ¡
If ¡the ¡amount ¡of ¡water ¡in ¡the ¡meadow ¡decreases, ¡ then ¡the ¡living ¡areas ¡for ¡toads ¡will ¡decrease. ¡ If ¡predators ¡inhabit ¡a ¡pond, ¡then ¡less ¡toads ¡are ¡ present ¡ If ¡lower ¡water ¡pH ¡is ¡found, ¡then ¡there ¡are ¡less ¡toads. ¡ We ¡expect ¡more ¡juvenile ¡toads ¡then ¡adult ¡toads ¡to ¡be ¡ found ¡
SLIDE 4
Material ¡List ¡
Calipers ¡ Thermometers ¡ Meter ¡tape ¡ ¡ Test ¡Tubes ¡ Notebooks/Data ¡tables ¡ ¡pH ¡paper ¡
SLIDE 5
Process ¡Of ¡Experiment ¡ ¡
Crea0ng ¡10X10 ¡Plots ¡
12 ¡throughout ¡the ¡meadow ¡ ¡
Measuring ¡Western ¡Toads ¡within ¡the ¡plots ¡ Measuring ¡the ¡pH ¡of ¡the ¡water ¡ Checking ¡the ¡pools ¡in ¡the ¡Yuba ¡River ¡
Prey ¡present/absent ¡ Predators ¡present/absent ¡
SLIDE 6
Where ¡In ¡Meadow ¡Traveled ¡
1st ¡Group ¡went ¡to ¡the ¡Upper ¡Yuba ¡River ¡ 2nd ¡Group ¡went ¡to ¡the ¡Lower ¡Yuba ¡River ¡ 3rd ¡Group ¡went ¡to ¡Castle ¡Creek ¡and ¡Lake ¡Van ¡ Norden ¡ ¡ ¡
SLIDE 7 Results ¡
1.844444444 ¡ 0 ¡ 0.5 ¡ 1 ¡ 1.5 ¡ 2 ¡ 2.5 ¡ 3 ¡ 0 ¡ 5 ¡ 10 ¡ 15 ¡ 20 ¡ 25 ¡ 30 ¡ 35 ¡ 40 ¡
Toad ¡Size ¡ Individual ¡Toads ¡ Toad ¡Size ¡(cm) ¡
SLIDE 8 Toad ¡Habitat ¡
0 ¡ 5 ¡ 10 ¡ 15 ¡ 20 ¡ 25 ¡ 30 ¡ 35 ¡ 40 ¡ Wet ¡ Dry ¡ Wet ¡ Dry ¡
# ¡of ¡Toads ¡Found ¡per ¡plot ¡
SLIDE 9 0 ¡ 5 ¡ 10 ¡ 15 ¡ 20 ¡ 25 ¡ 30 ¡ 35 ¡ 40 ¡ 45 ¡ 5 ¡ 7 ¡
Toads ¡Vs ¡Ph ¡
pH ¡
Average ¡Number ¡of ¡Toads ¡per ¡Plot ¡
SLIDE 10 Toads ¡and ¡Predators ¡
0 ¡ 5 ¡ 10 ¡ 15 ¡ 20 ¡ 25 ¡ ¡Nothing ¡Present ¡ No ¡Toads, ¡Yes ¡Predators ¡ Yes ¡Toads, ¡No ¡Predators ¡ Yes ¡Toads, ¡Yes ¡Predators ¡
Number ¡of ¡pools ¡
SLIDE 11
Discussion ¡
How ¡many ¡toads ¡were ¡found? ¡ Where ¡can ¡they ¡live? ¡ What ¡will ¡happen ¡to ¡them ¡if ¡they ¡live ¡in ¡dry ¡ lands? ¡ What ¡was ¡in ¡the ¡rivers? ¡ ¡
SLIDE 12 Discussion ¡ ¡
¡ What ¡are ¡some ¡predators? ¡ What ¡were ¡some ¡under ¡water ¡plants? ¡ What ¡were ¡some ¡other ¡species ¡we ¡saw? ¡ How ¡did ¡the ¡drought ¡affect ¡the ¡toads ¡and ¡the ¡
¡
SLIDE 13
Hypotheses ¡
If ¡the ¡amount ¡of ¡water ¡in ¡the ¡meadow ¡decreases, ¡ then ¡the ¡living ¡areas ¡for ¡toads ¡will ¡decrease. ¡ Yes, ¡because ¡the ¡toads ¡need ¡moist ¡areas ¡so ¡they ¡ can ¡breathe ¡and ¡without ¡the ¡water ¡their ¡skin ¡will ¡ dry ¡out ¡ If ¡predators ¡inhabit ¡a ¡pond, ¡then ¡less ¡toads ¡are ¡ present ¡ Yes, ¡because ¡the ¡toads ¡don’t ¡want ¡to ¡get ¡eaten ¡so ¡ they ¡migrate ¡to ¡a ¡different ¡ponds ¡
¡
SLIDE 14
Hypotheses ¡ ¡
If ¡lower ¡water ¡pH ¡is ¡found, ¡then ¡there ¡are ¡less ¡ toads ¡ Yes, ¡because ¡toads ¡can ¡only ¡survive ¡in ¡neutral ¡pH ¡ levels ¡ We ¡expect ¡more ¡juvenile ¡toads ¡then ¡adult ¡toads ¡ to ¡be ¡found ¡ Yes, ¡because ¡adult ¡toads ¡have ¡many ¡children ¡and ¡ if ¡you ¡look ¡at ¡the ¡graphs ¡in ¡our ¡slides ¡you ¡will ¡see ¡ the ¡ra0o ¡from ¡juvenile ¡to ¡adult ¡toads ¡
SLIDE 15
Photos ¡and ¡Video ¡
SLIDE 16
SLIDE 17
SLIDE 18
SLIDE 19