
SLIDE 1
1
TSX: ROXG
TSX: ROXG
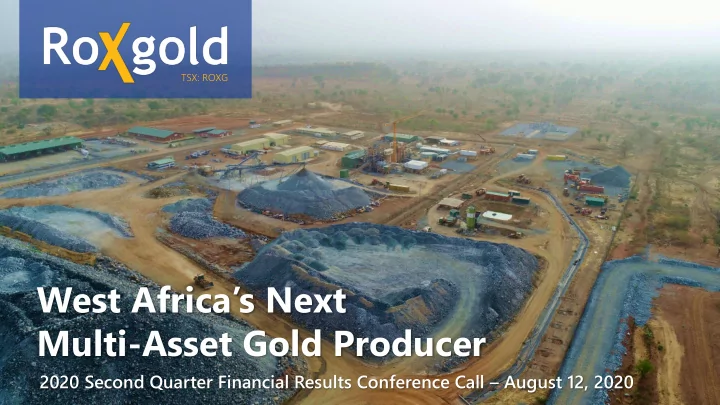
West Africa’s Next Multi-Asset Gold Producer
2020 Second Quarter Financial Results Conference Call – August 12, 2020
West Africas Next Multi-Asset Gold Producer 2020 Second Quarter - - PowerPoint PPT Presentation
TSX: ROXG West Africas Next Multi-Asset Gold Producer 2020 Second Quarter Financial Results Conference Call August 12, 2020 TSX: ROXG 1 Cautionary Statement This presentation contains forward-looking information. Forward looking
1
TSX: ROXG
TSX: ROXG
2020 Second Quarter Financial Results Conference Call – August 12, 2020
2
TSX: ROXG
This presentation contains forward-looking information. Forward looking information contained in this presentation includes, but is not limited to, statements with respect to: (i) the estimation of measured, inferred and indicated mineral resources and proven and probable mineral reserves including, without limitation, statements with respect to the potential establishment of new mineral resources and/or reserves and the expansion potential of existing mineral resources/reserves and the expansion potential of mining operations; (ii) proposed exploration and development activities (including reinvestment in operating mines), and the anticipated cost, nature, success and timing thereof, as well as any potential resulting mineralization and/or margin potential; (iii) production, earnings, recovery rates, throughput, margin, and cost guidance as well as future sources of funding, cash flow, capital expenditures and exploration budgets, (iv) permitting; and (v) expansion and growth potential and the anticipated timing thereof, future economics and development activities related thereto, and other future production and anticipated grades; (vi) statements that are not of historical fact; (vii) anticipated production and resource growth; (viii) future external growth opportunities including with respect to the Séguéla gold project and other permits, and the potential prospectivity thereof; and (ix) the development potential of the Séguéla gold project and the Preliminary Economic Assessment and an upgraded Mineral Resource estimate for the Séguéla Gold Project. For further details regarding the Yaramoko project, please refer to the technical report entitled “Technical Report for the Yaramoko Gold Mine, Burkina Faso” dated December 20, 2017 (the “Yaramoko Technical Report”) and the technical report prepared for the Séguéla Gold Project entitled “NI 43- 101 Technical Report, Séguéla Project, Worodougou Region, Côte d’Ivoire” dated July 23, 2019 (the “Séguéla Technical Report” and together with the Yaramoko Technical Report, the “Technical Reports”. These statements are based on information currently available to the Company and the Company provides no assurance that actual results will meet management's expectations. In certain cases, forward-looking information may be identified by such terms as "anticipates", "believes", "could", "estimates", "expects", "may", "shall", "will", or "would". Forward-looking information contained in this presentation is based on certain factors and assumptions regarding, among other things, the estimation of mineral resources and mineral reserves (and potential establishment and increases in respect thereof), the potential expansion of mining operations, the realization of resource estimates and reserve estimates, gold metal prices, the timing, success and amount of future exploration and development expenditures, and materials to continue to explore and develop the Yaramoko project and other property interests in the short and long-term, the progress of exploration and development activities, the receipt of necessary regulatory approvals and permits, and assumptions with respect to currency fluctuations, environmental risks, title disputes or claims, and other similar matters. While the Company considers these assumptions to be reasonable based on information currently available to it, they may prove to be incorrect. Forward looking information involves known and unknown risks, uncertainties and other factors which may cause the actual results, performance or achievements of the Company to be materially different from any future results, performance or achievements expressed or implied by the forward-looking information. Such factors include risks inherent in the exploration, risks relating to variations in mineral resources and mineral reserves, grade or recovery rates resulting from current exploration and development activities (including risks that new mineral resources and/or reserves may not be established, or the anticipated expansion potential of existing mineral resources/reserves or mining operations may not be realized), risks relating to changes in gold prices and the worldwide demand for and supply of gold, risks related to increased competition in the mining industry generally, risks related to current global financial conditions, including risks related to the current COVID-19 pandemic, uncertainties inherent in the estimation of mineral resources and mineral reserves, access and supply risks, reliance on key personnel, operational risks inherent in the conduct of mining activities including the risk of accidents, labour disputes, increases in capital and operating costs and the risk of delays or regulatory risks, including risks relating to the acquisition of the necessary licenses and permits, capitalization and liquidity risks, risks related to disputes concerning property titles and interest, risks that closing and environmental risks. Please refer to the 2019 AIF filed on SEDAR at www.sedar.com on March 16, 2020 for political, environmental or other risks that could materially affect the development of mineral resources and mineral reserves and other forward looking matters. This list is not exhaustive of the factors that may affect any of the Company's forward- looking information. These and other factors should be considered carefully and readers should not place undue reliance on the Company's forward-looking information. The Company does not undertake to update any forward-looking information that may be made from time to time by the Company or on its behalf, except in accordance with applicable securities laws. Unless stated otherwise herein, the following Qualified Persons, as defined in National Instrument 43-101, have prepared or supervised the preparation of the scientific or technical information presented in this presentation: Karl van Olden (CSA Global Pty Ltd), Paul Criddle, Chief Operating Officer (Roxgold), Mr. Hans Andersen, Senior Resource Geologist (Roxgold), and Paul Weedon, VP Exploration (Roxgold). The information presented herein was approved by management of Roxgold on August 11, 2020.
All amounts are in U.S. dollars unless otherwise stated.
3
TSX: ROXG
3
Processing plant continues to outperform
112,523 t
Ore Mined
127,308 t
Ore Processed
32,812 oz
Gold Production
8.2 g/t
Head Grade
98.0%
Average Recoveries Lost Time Injuries
5,000 10,000 15,000 20,000 25,000 30,000 35,000 40,000 45,000
Production
(ounces) 0.0 2.0 4.0 6.0 8.0 10.0 12.0
Head grade
(g/t) 20,000 40,000 60,000 80,000 100,000 120,000 140,000 160,000
Ore mined
(tonnes) 20,000 40,000 60,000 80,000 100,000 120,000 140,000
Ore processed
(tonnes)
4
TSX: ROXG
4
All amounts in US dollars
Q2 2020 Q2 2019
YOY Change
Gold produced (ounces) 32,812 34,354
Gold sold (ounces) 36,279 33,102
10%
Gold sales ($ million) $62.1 $42.9
45%
EBITDA1 ($ million) $25.5 $12.0
113%
Adjusted EBITDA1 ($ million) $29.0 $15.7
85%
Adjusted EBITDA margin1 47% 37%
27%
Average realized gold price $1,712/oz $1,304/oz
31%
Cash operating cost1 (per tonne processed) $151/t $156/t
Cash operating cost1 (per ounce produced) $586/oz $518/oz
13%
Total cash cost1 (per ounce sold) $696/oz $580/oz
20%
Sustaining capital cost1 (per ounce sold) $245/oz $206/oz
19%
Site all-in sustaining cost1,2 (per ounce sold) $940/oz $785/oz
20%
All-in sustaining cost1 (per ounce sold) $983/oz $836/oz
18%
Cash flow from mining operations1 $33.3 $21.8
53%
Cash flow from mining operations per share1 $0.09 $0.06
50%
Adjusted earnings per share1 $0.03 $0.00
NA
measure” section of the Company’s Q2 2020 MD&A available on www.roxgold.com or www.sedar.com
Cash Operating Cost1 $586/oz produced All-In Sustaining Cost1 $983/oz sold Adjusted EBITDA Margin1 47% Cash Flow From Mining Operations1 $33.3 M ($0.09 per share)
5
TSX: ROXG
Q2 2020 margins increase 40% over Q2 2019
$724 $895 $903 $938 $1,016
400 800 1,200 1,600 2,000 Q2 2019 Q3 2019 Q4 2019 Q1 2020 Q2 2020 $/oz Cash operating cost Total cash cost Mine operating margin AVG realized gold price
Operating Margin EBITDA and Net Income
1. This is a non-IFRS financial performance measure with no standard definition under IFRS. See the “non-IFRS financial performance measure” section of the Company’s Q1 2020 MD&A available on www.roxgold.com or www.sedar.com
$0 $5 $10 $15 $20 $25 $30 $35 Q2 2019 Q3 2019 Q4 2019 Q1 2020 Q2 2020 $ million adj EBITDA Adj net income
1 1 1 1
6
TSX: ROXG
Generating cash flow to support growth plans
Solid liquidity position at end of quarter with: cash balance
$44.8 M
&
additional RCF availability
$20 M Cash Balance Movement
Continued focus on value accretive spend at Séguéla and Boussoura
$6.2 M
Record cash flow from mining operations
$33.3 M
FCF (before growth spend)
$9.3 M
(includes income tax payment of $5.4 M in Q2)
FCF (before growth spend) Growth Financing
7
TSX: ROXG Gold Cash Operating
(per ounce produced)
AISC
(per ounce sold)
Non-sustaining Growth spend 2020 GUIDANCE
120K – 130K oz $520-$580 $930-$990 $5-$10M $15-$20M
2021 & 2022 GUIDANCE 120K – 130K oz $750-$850 NOTES
H1/20 production of 65,192 oz puts ROXG on track to meet upper end of 2020 guidance AISC in 2020 higher than norm as Bagassi South decline development is completed Growth spend has been maintained at $15- $20 million as the accelerated drilling program at Séguéla and Boussoura follow recent exploration successes at these projects. Mined grades at Bagassi South averaged a record 10.6 g/t in the quarter 55 Zone reported higher grades at depth with an average mined grade of 11.6 g/t in June 2020 PRODUCTION COSTS1 EXPENDITURE
H1/20 production of 65,192 oz puts Roxgold on track for upper end of guidance
1. This is a non-IFRS financial performance measure with no standard definition under IFRS. See the “non-IFRS financial performance measure” section of the Company’s Q1 2020 MD&A available on www.roxgold.com or www.sedar.com
8
TSX: ROXG
Comprehensive underground drill campaign starting in Q3 2020
Yaramoko Historical M&I Resources – 1.2M oz
Development @ 4734L (June 2020) Drilling Platform @ 4700L H2 2020
Planned Drilling Platform @ 4300L 2022
YRM-18-DD-426 20.1 g/t over 23.8 m See Appendix for Yaramoko Mineral Resource Statement
▪ Significant history of resource replacement and conversion of Inferred to Indicated Resource ▪ Improved understanding of key mineralization controls through detailed mapping and geostatistics ▪ Structural repetition of high-grade zones becoming apparent ▪ Planning a dedicated underground drill platform in H2 2020
2014 2016 2018 Measured Indicated Cumulative Prod.
810 koz 738 koz
813 koz
826 koz
1,161 koz
9
TSX: ROXG
April April 2019 2019 2020 2020 2021 2021
Opportunities & Next Steps
PEA
File for permits Mining permit
Feasibility Study
through exploration
Construction decision
9
TSX: ROXG
Infill & target exploration Extension drill program Updated resource Ancien Agouti & Boulder Updated resource
Acquisition
10
TSX: ROXG
Ancien results push target up the value chain
▪ 69 RC/DD drill hole program has highlighted a broad zone of well-defined high-grade mineralization ▪ Numerous high-grade intersections across significant widths ▪ Drilling since PEA cut-off has filled out the pit with additional mineralization ▪ Deposit remains open at depth ▪ Potential 2nd high-grade shoot developing in north ▪ 2 rigs currently testing extensions
Ancien Longsection Ancien Progress
See Appendix for Séguéla Gold Project Mineral Resource Statement
11
TSX: ROXG
▪ Séguéla has over 28 highly prospective exploration targets with potential to increase resource base with low cost near- surface ounces ▪ Sampling program identified several highly prospective targets with several instances of high-grade visible gold ▪ At least 3 emerging structural corridors with eastern and southern margins remain only lightly explored Target definition programs underway ▪ Reconnaissance RC drill testing of early stage targets with potential to add near-term satellite ounces: Folly, Antenna East, Agouti-Boulder Corridor, Kwenko/Winy, etc. ▪ Regional auger drilling across untested prospective stratigraphy & structures (eg Ancien corridor) with aircore follow up => generate targets for subsequent RC drill testing Resource extensions ▪ Potential strike/dip/plunge extensions to existing deposits: Ancien (O/P & U/G), Agouti, Boulder, A-B Corridor, P3
Portfolio of near surface high grade deposits
11
Séguéla Reconnaissance Sampling Program
12
TSX: ROXG
▪ Boussoura has seen little formal exploration activities since being staked in July 2014 ▪ Project lies on the same greenstone belt as Yaramoko and
▪ Property has seen substantial increase in artisanal activity in the north (Fofora) and south (Galgouli) ▪ Roxgold has drilled over 10,000 m in 80 holes
Fofora
300-400 m
dated much of the more recent artisanal workings
Galgouli
km
Roxgold’s new high grade discovery
13
TSX: ROXG
Numerous vein sets within close proximity
Fofora
▪ Numerous shear zones and vein corridors within an active 9 km2 artisanal field ▪ Corridors host a series of N-NW striking shear zones with surface strike lengths of up to 1,000m ▪ Vein sets share coincident artisanal workings, geophysical and geochemical anomalies ▪ 58 RC and DD drill holes have intersected high grade mineralisation along Fofora Main vein set and vein corridors to the west ▪ Two mineralization styles have identified with broad lower grade zones extending up to 60m in width and interpreted as representing siliceous halos to much higher grade quartz veins (10 to >100 g/t intervals with high levels of coarse gold) over 1-4m intervals ▪ Mineralization is associated with a series of sheared felsic dykes, associated quartz veining and intense silica alteration and replacement with a variable dip from steep westerly to ~70 degrees east
See Appendix – Endnote 7, 11
14
TSX: ROXG
Building the foundation to become a multi-asset producer
Yaramoko Séguéla Boussoura Boussoura Regional Yaramoko Regional Côte d’Ivoire Regional Séguéla Regional
(Remaining 22 satellite targets)
Early Exploration Advanced Exploration Development & Technical Studies Production
BURKINA FASO CÔTE D’IVOIRE
14
Defined resource Advanced target Greenfield target
15
TSX: ROXG
www.roxgold.com TSX: ROXG
16
TSX: ROXG
17
TSX: ROXG Proven Mineral Reserves Probable Mineral Reserves Proven and Probable Mineral Reserves
Tonnes (000) Grade g/t Au Ounces (000) Tonnes (000) Grade g/t Au Ounces (000) Tonnes (000) Grade g/t Au Ounces (000) 55 Zone 386 9.46 117 1,314 7.84 331 1,700 8.21 449 Bagassi South 49 7.50 12 612 9.12 179 661 9.00 191 Stockpiles 123 4.68 18
4.68 18 Total 558 8.21 147 1,926 8.25 511 2,484 8.24 658
As of December 31, 2018
1. Mineral Reserves are reported in accordance with NI 43-101 with an effective date of December 31, 2018 and are included in Mineral Resources. Mineral Reserve estimates reflect the Company’s reasonable expectation that all necessary permits be maintained. Mining dilution and mining recovery vary by deposit and have been applied in estimating the Mineral Reserves. 2. Mineral Reserves are the economic portion of the Measured and Indicated Mineral Resources. Mineral Reserve estimates including mining dilution at grades assumed to be1.2g/t and 1.0g/t gold for 55 Zone and Bagassi South respectively. Mining dilution and recovery factors vary with specific reserve sources and are influenced by several factors including deposit type, deposit shape and mining methods. 3. The 2018 Mineral Reserves were prepared under the supervision of Benny Zhang, Principal Mining Engineer at SRK, Peng (PEO # 100115459). Mr. Benny Zhang is a Qualified Person as defined by NI 43- 101 and independent of the Company. 4. The Mineral Reserve Statement effective on December 31, 2018 is reported at a cut-off grade of 3.7 g/t gold for the Zone 55 deposit assuming metal price of US$1,300 per ounce of gold, mining cost of US$98.19 per tonne, G&A cost of US$19.31 per tonne, processing cost of US$23.75 per tonne, and process recovery of 98.3%; and a cut-off grade of 3.1 g/t gold for the Bagassi South deposit assuming metal price of US$1,300 per ounce of gold, mining cost of US$76.10 per tonne, G&A cost of US$19.31 per tonne, processing cost of US$23.75 per tonne, and process recovery of 98.3%. Reserve estimates include mining dilution and mining recovery. 5. All figures have been rounded to reflect the relative accuracy of the estimates. 6. For further information, please refer to the technical report dated December 20, 2017 and entitled “Technical Report for the Yaramoko Gold Mine, Burkina Faso” available the Company’s website and on SEDAR at www.sedar.com. Yaramoko is subject to a 10% carried interest held by the Government of Burkina Faso
18
TSX: ROXG
As of December 31, 20181
Measured Mineral Resources Indicated Mineral Resources Measured and Indicated Mineral Resources Inferred Mineral Resources
Tonnes (000) Grade g/t Au Ounces (000) Tonnes (000) Grade g/t Au Ounces (000) Tonnes (000) Grade g/t Au Ounces (000) Tonnes (000) Grade g/t Au Ounces (000) 55 Zone (in-situ) 382 14.1 173 1,135 11.0 400 1,517 11.8 573 384 12.8 158 Bagassi South (in-situ) 37 13.5 16 445 15.3 219 482 15.2 236 93 11.1 33 Stockpiles 123 4.7 18
4.7 18
542 11.9 208 1,580 12.2 619 2,122 12.13 827 477 12.4 191
1. Mineral Resources are reported in accordance with NI 43-101 with an effective date of March 9, 2019 and March 25, 2019, for the 55 Zone and Bagassi South respectively (collectively “Yaramoko”). The Yaramoko Mineral Resources reflect that they have been depleted for mining and mine development up to December 31, 2018. Depletion also includes artisanal workings close to the surface. 2. The Yaramoko Mineral Resources are reported at gold grade cut-off of 3.5 g/t Au, assuming: metal price of US$1,450,oz Au, mining cost of US$85.00/t, general and administration (G&A) cost of US$22.00/t, processing cost of US$31.00/t, process recovery of 98.5%. 3. The Mineral Resources have been classified under the guidelines of the CIM Standards on Mineral Resources and Reserves, Definitions and Guidelines prepared by the CIM Standing Committee on Reserve Definitions and adopted by CIM Council (2014), and procedures for classifying the reported Mineral Resources were undertaken within the context of the Canadian Securities Administrators NI 43-101. 4. The Yaramoko Mineral Resource Statement was prepared under the supervision of Dr. Belinda van Lente, Principal Resource Geologist at CSA Global (UK) Ltd. Dr. van Lente is a Qualified Person as defined in NI 43-101 and independent of the Company. 5. All figures have been rounded to reflect the relative accuracy of the estimates. 6. Mineral Resources that are not Mineral Reserves do not necessarily demonstrate economic viability. 7. For further information, please refer to the technical report dated December 20, 2017 and entitled “Technical Report for the Yaramoko Gold Mine, Burkina Faso” available the Company’s website and
Yaramoko is subject to a 10% carried interest held by the Government of Burkina Faso
19
TSX: ROXG
As of April 14th, 20201
1. Mineral Resources are reported in accordance with NI 43-101 with an effective date of April 14, 2020, for Séguéla. 2. The Séguéla Mineral Resources are reported on a 100% basis at a gold grade cut-off of 0.3g/t Au for Antenna and 0.5g/t Au for the satellite deposits, based on a gold price of US$1,550/ounce and constrained to MII preliminary pit shells. 3. The identified Mineral Resources in the block model are classified according to the “CIM” definitions for the Measured, Indicated, and Inferred categories. The Mineral Resources are reported in situ without modifying factors applied. 4. The Séguéla Mineral Resource Statement was prepared under the supervision of Mr Hans Andersen, Senior Resource Geologist at Roxgold Inc. Mr Andersen is a Qualified Person as defined in NI 43- 101. 5. All figures have been rounded to reflect the relative accuracy of the estimates and totals may not add due to rounding. 6. Mineral Resources that are not Mineral Reserves do not necessarily demonstrate economic viability. Séguéla is subject to a 10% carried interest held by the Government of Côte d’Ivoire and a 1.5% NSR
Measured Mineral Resources Indicated Mineral Resources Measured and Indicated Mineral Resources Inferred Mineral Resources
Tonnes (000) Grade g/t Au Ounces (000) Tonnes (000) Grade g/t Au Ounces (000) Tonnes (000) Grade g/t Au Ounces (000) Tonnes (000) Grade g/t Au Ounces (000)
Antenna
2.3 529 7,064 2.3 529 892 2.2 64 Boulder
1.2 72 Agouti
2.6 110 Ancien
6.1 261 Total
2.3 529 7,064 2.3 529 5,373 2.9 508
Graeme Jennings, CFA | Vice President Investor Relations | gjennings@roxgold.com | 416 203 6401
TSX: ROXG www.roxgold.com