
SLIDE 1
WELCOME!
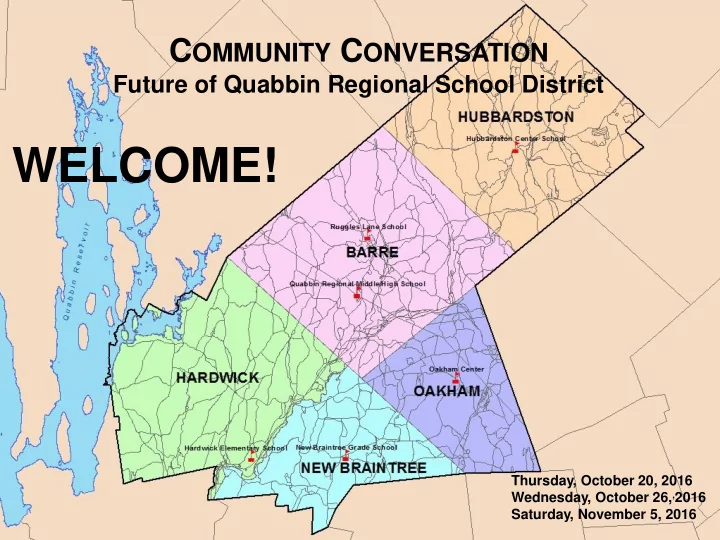
COMMUNITY CONVERSATION
Future of Quabbin Regional School District
Thursday, October 20, 2016 Wednesday, October 26,,2016 Saturday, November 5, 2016
WELCOME! Thursday, October 20, 2016 Wednesday, October 26, , 2016 - - PowerPoint PPT Presentation
C OMMUNITY C ONVERSATION Future of Quabbin Regional School District WELCOME! Thursday, October 20, 2016 Wednesday, October 26, , 2016 Saturday, November 5, 2016 Why are We Here Today? Difficult budget processes in recent years Less
Future of Quabbin Regional School District
Thursday, October 20, 2016 Wednesday, October 26,,2016 Saturday, November 5, 2016
How do we provide schools with the solid foundation needed to provide a quality education?
Summary:
Cost of education is increasing faster than state aid and town revenues can handle.
Town Assessments (FY2012 - FY2017) FY2012 FY2017 Dollar Change Percent Change Barre 4,215,708 5,213,612 997,904 23.67% Hardwick 2,012,529 2,370,321 357,792 17.78% Hubbardston 3,488,762 4,332,544 843,782 24.19% New Braintree 1,043,905 1,213,526 169,622 16.25% Oakham 1,537,870 2,064,774 526,904 34.26% Total 12,298,774 15,194,778 2,896,004 23.55%
SCHOOL SPACE USE
(30-67% of capacity)
Changes in Total Assessed Valuation FY2007-FY2016 FY2007 FY2016 Dollar Change Percent Change Barre 474,526,461 400,479,913
Hardwick 263,380,887 226,213,700
Hubbardston 488,635,274 395,563,065
New Braintree 113,029,238 105,051,471
Oakham 213,378,581 190,647,859
Changes in State Aid: FY2009-FY2017 FY2009 FY2017 Dollar Change Percent Change Barre 1,158,319 1,052,998
Hardwick 561,462 560,644
Hubbardston 603,604 537,758
New Braintree 210,539 186,833
Oakham 377,927 281,590
Note: First table is value of property, not actual budget
influence the amount of revenue generated. Second table is actual revenue.
Property Value Residential vs Commercial/Industrial Residential Commercial Barre 84.0% 16.0% Hardwick 90.7% 9.3% Hubbardston 93.4% 6.6% New Braintree 94.3% 5.7% Oakham 92.8% 7.2% Revenue from New Growth (10-Year Average) Barre 130,547 Hardwick 42,920 Hubbardston 86,691 New Braintree 24,782 Oakham 28,383 5-Town Total 313,322
School spending figure includes assessment for vocational schools.
School Spending as Percent of FY2017 Town Budget Barre 50.65% Hardwick 54.11% Hubbardston 60.21% New Braintree 60.98% Oakham 60.70%
How do we provide schools with the solid foundation needed to provide a quality education?
Table Template
Conversation Notes Harvest Notes
Capture key responses in “PRESENT” section of Table Template
10 minutes
tables
Welcome new Guests Invite others to speak first
during next conversation
Capture key responses in “FUTURE” section of Table Template
15 minutes
tables
Welcome new Guests Invite others to speak first
during next conversation
Capture key responses in “POSSIBILITIES & CONCERNS” section of Table Template
15 minutes
5 minutes
Also list on sticky notes.
tables
Welcome new Guests Invite others to speak first
during next conversation
Capture key responses in “VALUES & IDEAS” section of Table Template
15 minutes
5 minutes
Also list on sticky notes.