WELCOME 1 Audio Details Questions during the All lines are muted - - PowerPoint PPT Presentation

welcome
SMART_READER_LITE
LIVE PREVIEW

WELCOME 1 Audio Details Questions during the All lines are muted - - PowerPoint PPT Presentation

WELCOME 1 Audio Details Questions during the All lines are muted upon entry presentation? into the meeting. Questions can be taken over the audio For those using audio via bridge or submit a question to us in the Microsoft Teams


slide-1
SLIDE 1

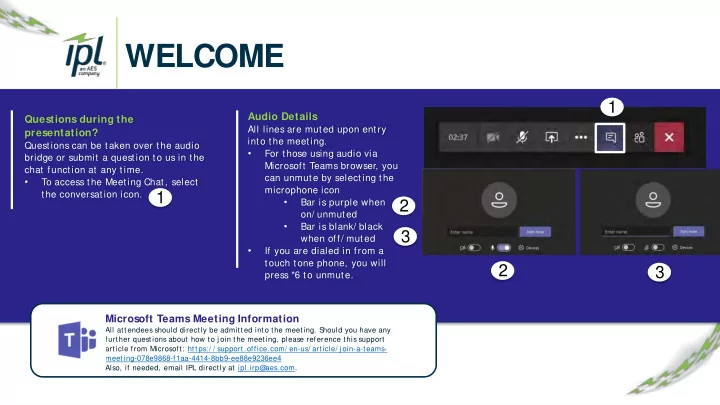
Questions during the presentation?

Questions can be taken over the audio bridge or submit a question to us in the chat function at any time.

  • To access the Meeting Chat, select

the conversation icon.

Audio Details

All lines are muted upon entry into the meeting.

  • For those using audio via

Microsoft Teams browser, you can unmute by selecting the microphone icon

  • Bar is purple when
  • n/ unmuted
  • Bar is blank/ black

when off/ muted

  • If you are dialed in from a

touch tone phone, you will press *6 to unmute.

Microsoft Teams Meeting Information

All attendees should directly be admitted into the meeting. S hould you have any further questions about how to j oin the meeting, please reference this support article from Microsoft: https:/ / support.office.com/ en-us/ article/ j oin-a-teams- meeting-078e9868-f1aa-4414-8bb9-ee88e9236ee4 Also, if needed, email IPL directly at ipl.irp@ aes.com.

1 1

WELCOME

3 3 2 2

slide-2
SLIDE 2

INDIANAPOLIS POWER & LIGHT COMP ANY

IPL 2019 IRP: PUBLIC ADVISORY MEETING #5

DECEMBER 9, 2019

slide-3
SLIDE 3

INTRODUCTIONS & SAFETY MESSAGE

Shelby Houston

Regulat ory Analyst , IPL

3

slide-4
SLIDE 4

MEETING OBJECTIVES & AGENDA

S tewart Ramsey

Meet ing Facilit at or, Vanry & Associat es

2019 IRP S takeholder Meeting 12.9.19 4

slide-5
SLIDE 5

AGENDA

2019 IRP S takeholder Meeting 12.9.19 5

Topic Time (Eastern) Presenter(s) Registration & Breakfast 9:00 – 9:30

  • Introductions & Safety Message

9:30 – 9:40 Shelby Houston, Regulatory Analyst, IPL Meeting Objectives & Agenda 9:40 – 9:50 Stewart Ramsay, Meeting Facilitator, Vanry & Associates Executive Summary of Preferred Resource Plan 9:50 – 10:20 Vince Parisi, President and CEO, IPL 2019 IRP: Modeling Insights 10:20 – 10:50 Patrick Maguire, Director of Resource Planning, IPL BREAK 10:50 – 11:00 Analysis of Alternatives: 2019 IRP Modeling 11:00 – 12:00 Patrick Maguire, Director of Resource Planning, IPL LUNCH 12:00 – 12:45 Sensitivity Analysis 12:45 – 1:15 Patrick Maguire, Director of Resource Planning, IPL Preferred Resource Portfolio & Short Term Action Plan 1:15 – 1:30 Patrick Maguire, Director of Resource Planning, IPL Concluding Remarks 1:30 – 2:00 Vince Parisi, President and CEO, IPL Stewart Ramsay, Meeting Facilitator, Vanry & Associates

slide-6
SLIDE 6

EXECUTIVE SUMMARY OF SHORT TERM ACTION PLAN

Vince Parisi,

President and CEO, IPL

2019 IRP S takeholder Meeting 12.9.19 6

slide-7
SLIDE 7

IPL 2019 IRP

2019 IRP S takeholder Meeting 12.9.19 7

“ ‘Preferred resource portfolio’

means the utility's selected long term supply-side and demand-side resource mix that safely, reliably, efficiently, and cost-effectively meets the electric system demand, taking cost, risk, and uncertainty into

consideration.”

170 IAC 4-7-1(cc)

What is a preferred resource portfolio? INTEGRATED RESOURCE PLAN (IRP): IPL's plan to provide safe, reliable, and sustainable energy solutions for the communities we serve

  • IRP submitted every three years
  • Plan created with stakeholder input
  • 20-year look at how IPL will serve load
  • Modeling and analysis culminates in a

preferred resource portfolio

slide-8
SLIDE 8

2019 IRP STAKEHOLDER PROCESS

January 29th

  • 2016 IRP Recap
  • 2019 IRP Timeline,

Obj ectives, S takeholder Process

  • Capacity Discussion
  • IPL Existing Resources

and Preliminary Load Forecast

  • Introduction to

Ascend Analytics

  • S

upply-S ide Resource Types

  • DS

M/ Load Forecast S chedule March 13th

  • S

takeholder Presentations

  • Commodity

Assumptions

  • Capital Cost

Assumptions

  • IPL-Proposed S

cenario Framework

  • S

cenario Workshop

  • MPS

Update and Plan May 14th

  • S

ummary of S takeholder Feedback

  • Present Final

S cenarios

  • Modeling Update
  • Assumptions Review

and Updates September 30th

  • S

ummary of S takeholder Feedback

  • Preliminary Model

Results

  • S

cenario Descriptions and Results

  • Portfolio metrics and

scoring December 9th

  • Final Model Results
  • Full set of portfolio

metrics and scoring criteria

  • Preferred Plan
  • S

hort Term Action Plan

8 IPL set out to conduct a robust and collaborative stakeholder process. Multiple communication avenues were provided to ensure that all viewpoints and suggestions were heard from stakeholders wanting to participate in the 2019 IRP process.

slide-9
SLIDE 9

IPL PORTFOLIO DIVERSIFICATION: 2009 - 2018

2019 IRP S takeholder Meeting 12.9.19 9

2009 S igned 100 MW PP A at Hoosier Wind Park in NW Indiana 2011 S igned 200 MW PP A at Lakefield Wind Farm in Minnesota 2013-2015 S igned 96 MW PP A for solar in Indianapolis through Rate REP 2016 Retired 260 MW of coal at Eagle Valley 2016 Finalized conversion

  • f 630 MW
  • f coal-fired

generation at Harding S treet to natural gas 2018 Eagle Valley 671 MW Gas-Fired Combined Cycle Plant Completed

slide-10
SLIDE 10

IPL PREFERRED PORTFOLIO & SHORT-TERM ACTION PLAN

Retire 630 MW of coal generation by 2023:

  • Pete 1: 2021
  • Pete 2: 2023

RETIRE

Competitively bid for approximately 200 MW of firm capacity with all- source RFP

REPLACE

Target ~130,000 MWh per year of new DS M as part

  • f the 2021-2023

DS M Plan

SAVE

Maintain cost- effective units to retain flexibility and continue to monitor market conditions leading to our 2022 IRP

MONITOR

10

slide-11
SLIDE 11

BENEFITS OF PREFERRED RESOURCE PORTFOLIO

11

Considers current and forecasted market economics

Least Cost

Moves the company to more renewables

Greener Energy Future

Focus on customer needs and wants Measured approach maintaining optionality

Flexibility & Balance IPL Preferred Portfolio: Areas

  • f Focus

Customer Centricity

2019 IRP S takeholder Meeting 12.9.19

slide-12
SLIDE 12

CUSTOMER CENTRICITY

12 2019 IRP S takeholder Meeting 12.9.19

  • IPL’ s Preferred Resource Portfolio delivers safe, reliable,

and economic electricity to customers at j ust and reasonable rates

  • The preferred resource portfolio best serves IPL

customers today and into the future, contemplates

customers’ evolving energy needs, and relies on data-

driven models

Focus on cust omer needs and want s

slide-13
SLIDE 13

LEAST COST

13 2019 IRP S takeholder Meeting 12.9.19

Present Value Revenue Requirement ($Billion)

$6.6 $7.6

Reference Case

$7.2 $8.1

Scenario A

$7.7 $8.5

Scenario B

$6.4 $7.2

Scenario C

$7.3 $8.5

Scenario D Preferred Portfolio

Minimizes t ot al port folio cost

Preferred Resource Portfolio is the lowest cost portfolio across a wide range of futures, mitigating rate impact and allowing customers to take advantage of low cost renewables in the short term

←Higher Cost Lower Cost →

slide-14
SLIDE 14

FLEXIBILITY & BALANCE

Preferred Portfolio provides lowest cost plan considering information known today IPL has built-in flexibility to change direction in future IRPs with new information

Measured approach maint aining opt ionalit y

Preferred portfolio contains embedded optionality with Petersburg Units 3 and 4

2019 IRP 2022 2025 2028

14

slide-15
SLIDE 15

GREENER ENERGY FUTURE

15 2019 IRP S takeholder Meeting 12.9.19 Moves t he company t o more renewables

0.79 0.69 0.59 0.56 0.54 0.56 0.57 0.55 1.06 1.05 1.06 1.04 1.05 1.05 1.08 1.04 1.05 0.89 0.85 0.81 0.80 0.77 0.80 0.80 0.80 0.81 0.82 0.82 2009 2010 2011 2012 2013 2014 2015 2016 2017 2018 2019 2020 2021 2022 2023 2024 2025 2026 2027 2028

48% Decrease in carbon intensity by 2024

Status Quo Portfolio Preferred Portfolio Forecast →

2014 2024

2,600 MW 1,000 MW IPL Coal Capacity

  • 60%

Short-tons/MWh

slide-16
SLIDE 16

BENEFITS OF PREFERRED RESOURCE PORTFOLIO

16

Considers current and forecasted market economics

Least Cost

Moves the company to more renewables

Greener Energy Future

Focus on customer needs and wants Measured approach maintaining optionality

Flexibility & Balance IPL Preferred Portfolio: Areas

  • f Focus

Customer Centricity

2019 IRP S takeholder Meeting 12.9.19

slide-17
SLIDE 17

2019 IRP: MODELING INSIGHTS

Patrick Maguire

Direct or of Resource Planning, IPL

2019 IRP S takeholder Meeting 12.9.19 17

slide-18
SLIDE 18

HIGH IMPACT MARKET FORCES

  • S

ignificant market changes over the past 10 years have

impacted IPL’s existing resources

  • Opportunities and risk associated with alternative

resources

  • Present Value Revenue Requirement (PVRR) is key cost

metric that is impacted by relative economics of resource technologies

  • Look at underlying fundamentals key to understanding high impact

variables on all of the candidate portfolios

2019 IRP S takeholder Meeting 12.9.19 18

slide-19
SLIDE 19

COAL ECONOMICS (1 OF 3)

2019 IRP S takeholder Meeting 12.9.19 19

$0 $10 $20 $30 $40 $50 $60 $70

Fuel Cost ($/MWh)

Variable Fuel Cost: Coal vs. Gas, 1997 - 2018

Petersburg Natural Gas Combined Cycle ~130% increase in coal cost from 2005 to 2012 50-60% decrease in natural gas prices

slide-20
SLIDE 20

COAL ECONOMICS (2 OF 3)

2019 IRP S takeholder Meeting 12.9.19 20

$0 $50 $100 $150 $200 $250 $300 20,000 40,000 60,000 80,000 100,000 120,000 140,000 160,000 180,000 200,000 Variable Production Cost ($/MWh) Cumulative Capacity (MW)

MISO Generation Supply Stack

Petersburg Units

Wind additions shift supply curve right and depress off-peak prices Low natural gas prices flatten the supply curve, and natural-gas units displace coal in stack S

  • urce Dat a: S

&P Global

2014 2018

QUANTITY PRICE

MISO Min Load: ~50,000 MW MISO Avg Load: ~75,000 MW MISO Peak Load: ~120,000 MW

slide-21
SLIDE 21

($20) ($10) $0 $10 $20 $30 $40 $50 2006 2011 2016 2021 2026 2031 2036

Dark Spread (Nominal $/MWh)

IPL 2019 IRP: Modeled 7x24 Dark Spreads*

Modeled Stochastic Range Reference Case Scenario A: Carbon Tax Case Scenario B: Carbon + High Gas Scenario C: Carbon + Low Gas Scenario D: No Carbon + High Gas

HISTORICAL FORECASTED →

COAL ECONOMICS (3 OF 3)

2019 IRP S takeholder Meeting 12.9.19 21

Dark spread = LMP – variable production cost (fuel, VOM, emissions) Dark spread market indicator of variable margins to offset fixed costs. Does not include capacity value.

* Does not include capacity value * Not based on optimized dispatch

2020-2028: natural gas prices primary driver of risk to coal 2028+: 1. Carbon legislation 2. Renewable LMP ↓ pressure 3. Natural gas prices

slide-22
SLIDE 22

($20) ($10) $0 $10 $20 $30 $40 $50 2006 2011 2016 2021 2026 2031 2036

Dark Spread (Nominal $/MWh)

IPL 2019 IRP: Modeled 7x24 Dark Spreads*

HISTORICAL FORECASTED →

COAL ECONOMICS (3 OF 3)

2019 IRP S takeholder Meeting 12.9.19 22

Dark spread = LMP – variable production cost (fuel, VOM, emissions) Dark spread market indicator of variable margins to offset fixed costs. Does not include capacity value.

* Does not include capacity value * Not based on optimized dispatch

This is illustrative to show macro-level trends and forecasts in coal unit economics and is not inclusive of all factors needed to make a decision. The full IRP modeling used detailed hourly economic dispatch models and full cost accounting for coal and new capacity in the total portfolio cost calculation.

slide-23
SLIDE 23

WIND ECONOMICS: HEADWINDS AND UPSIDE POTENTIAL

2019 IRP S takeholder Meeting 12.9.19 23

$0 $10 $20 $30 $40 $50 $60 $70 $80 $90 $100 2020 2025 2030 2035 Nominal $/MWh

IPL IRP: Wind Captured Energy Revenue ($/MWh)

Wind - Reference Case Wind - Scenario A: Carbon Tax Case Wind LCOE (Nominal $/MWh) 80% PTC 60% PTC 40% PTC

Increase in Variable Cost ($/MWh) Carbon Price ($/ton) Coal Plant* Natural Gas Combined Cycle** $2 $2 $1 $5 $5 $2 $10 $11 $4 $20 $22 $8 $40 $43 $17

* 10.5 MMBtu/MWh heat rate, 206 lb/MMBtu CO2 emission rate ** 7.0 MMBtu/MWh heat rate, 119 lb/MMBtu CO2 emission rate

Carbon tax increases wholesale prices via increase in variable cost of fossil units on the margin

slide-24
SLIDE 24

WIND ECONOMICS: HEADWINDS AND UPSIDE POTENTIAL

2019 IRP S takeholder Meeting 12.9.19 24

$0 $10 $20 $30 $40 $50 $60 $70 $80 $90 $100 2020 2025 2030 2035 Nominal $/MWh

IPL IRP: Wind Captured Energy Revenue ($/MWh)

Wind - Reference Case Wind - Scenario A: Carbon Tax Case Wind LCOE (Nominal $/MWh) 80% PTC 60% PTC 40% PTC

Challenging wind economics with PTC phaseout Headwinds:

  • Each 20%

reduction in PTC increases LCOE by $3-$5/ MWh

  • Captured revenue remains

hampered by production shapes, congestion Upside potential:

  • New bulk transmission
  • Co-located storage
  • New load near site
  • Carbon Tax
  • PTC Extension

Acting early improves economics

slide-25
SLIDE 25

SOLAR ECONOMICS: FAVORABLE IN SHORT TERM, LONG TERM RISKS

2019 IRP S takeholder Meeting 12.9.19 25

$0 $20 $40 $60 $80 $100 2020 2025 2030 2035 Nominal $/MWh IPL IRP: Solar Captured Energy Revenue ($/MWh) Solar - Reference Case Solar - Scenario A: Carbon Tax Case Solar LCOE (Nominal $/MWh) $0 $10 $20 $30 $40 $50 $60 1 2 3 4 5 6 7 8 9 10 11 12 13 14 15 16 17 18 19 20 21 22 23 24 $/MWh Hour Ending

June 2019 Hourly Price Shape: MISO vs. California

Indiana.Hub (MISO) SP15 (CAISO)

Risk of revenue erosion as more solar installed in MISO

slide-26
SLIDE 26

0% 10% 20% 30% 40% 50% 60% 70% 80% 90% 100% 500 1,000 1,500 2,000 2,500 3,000

1 2 3 4 5 6 7 8 9 10 11 12 13 14 15 16 17 18 19 20 21 22 23 24

Solar Average Summer Capacity Factor IPL Average Summer Load (MW) Hour Ending

SOLAR CAPACITY CREDIT: SUMMER

26

IPL Average Load and Solar Profile: Top 20 Summer Load Days 2016 - 2018

Summer capacity credit for single-axis tracking solar is 60-70% at low penetration levels

slide-27
SLIDE 27

SUMMER NET LOAD CURVE

27

IPL Summer Net Load Curve with Increasing Solar Penetration

Net Load Curve with 1,400 MW

  • f Solar

HE 20 Net Peak: 2,305 MW No Solar Load Curve HE 16 Peak: 2,631 MW 500 1,000 1,500 2,000 2,500 3,000 1 2 3 4 5 6 7 8 9 10 11 12 13 14 15 16 17 18 19 20 21 22 23 24 MW Hour Ending Net Load Curves with Increasing Solar in 50 MW increments

Net peak load shifts from HE 16 to HE 20-21 at 400-500 MW of solar

slide-28
SLIDE 28

SOLAR CAPACITY CREDIT

28

Average Capacity Credit % Marginal Capacity Credit %

0% 10% 20% 30% 40% 50% 60% 70% 80% 90% 100% Solar Capacity Credit MW of Installed Solar Estimated Summer Solar Capacity Credit for IPL System at Increasing Penetration Levels

Marginal capacity credit for solar erodes quickly past 400- 500 MW without intervention

Mitigation measures to improve solar capacity value: storage, demand response, geographically diverse locations, load shifting DS M/ EE measures

slide-29
SLIDE 29

SOLAR CAPACITY CREDIT: WINTER

29

0% 10% 20% 30% 40% 50% 60% 70% 80% 90% 100% 500 1,000 1,500 2,000 2,500 3,000 1 2 3 4 5 6 7 8 9 10 11 12 13 14 15 16 17 18 19 20 21 22 23 24 Solar Average Winter Capacity Factor IPL Average Winter Load (MW) Hour Ending

Limited capacity value in the winter for solar as a standalone resource

IPL Average Load and Solar Profile: Top 20 Winter Load Days 2016 - 2018

slide-30
SLIDE 30

BREAK

2019 IRP S takeholder Meeting 12.9.19 30

slide-31
SLIDE 31

ANALYSIS OF ALTERNATIVES: 2019 IRP MODELING

Patrick Maguire

Direct or of Resource Planning, IPL

2019 IRP S takeholder Meeting 12.9.19 31

slide-32
SLIDE 32

2019 IRP MODELING FRAMEWORK

2019 IRP S takeholder Meeting 12.9.19 32

Reference Case Scenario A: Carbon Tax Case Scenario B: Carbon + High Gas Scenario C: Carbon + Low Gas Scenario D: No Carbon + High Gas Portfolio 1 No Early Retirements Portfolio 2 Pete Unit 1 Retire 2021 Pete Units 2-4 Operational Portfolio 3 Pete 1 Retire 2021; Pete 2 Retire 2023 Pete Units 3-4 Operational Portfolio 4 Pete 1 Retire 2021; Pete 2 Retire 2023; Pete 3 Retire 2026; Pete Unit 4 Operational Portfolio 5 Pete 1 Retire 2021; Pete 2 Retire 2023; Pete 3 Retire 2026; Pete 4 Retire 2030

IRP Modeling Framework:

  • S

ystematic evaluation of coal retirements based

  • n age, size, and reasonable transition

pathways to allow for construction or acquisition of replacement capacity

  • S

tochastic capacity expansion with hourly chronological dispatch

  • Candidate portfolios stressed against a wide

range of uncertainty with stochastic scenario analysis

PORTFOLIOS SCENARIOS

slide-33
SLIDE 33

TESTING FOR COST EFFECTIVENESS OF INCREMENTAL DSM

2019 IRP S takeholder Meeting 12.9.19 33

Description DSM Decrements 1-3 DSM Decrements 1-4 DSM Decrements 1-5 Portfolio 1 No Early Retirements 1a 1b 1c Portfolio 2 Pete Unit 1 Retire 2021 Pete Units 2-4 Operational 2a 2b 2c Portfolio 3 Pete 1 Retire 2021; Pete 2 Retire 2023 Pete Units 3-4 Operational 3a 3b 3c Portfolio 4 Pete 1 Retire 2021; Pete 2 Retire 2023; Pete 3 Retire 2026; Pete Unit 4 Operational 4a 4b 4c Portfolio 5 Pete 1 Retire 2021; Pete 2 Retire 2023; Pete 3 Retire 2026; Pete 4 Retire 2030 5a 5b 5c

Presented at S

  • ep. 30th Meeting ↓

IPL ran 10 additional capacity expansion runs with DS M decrements/ bundles forced in to ensure

  • ptimal level of DS

M targeted in 2021-2023 plan

New portfolios

slide-34
SLIDE 34

MODELING SUMMARY

  • Final modeling framework:
  • 15 candidate resource portfolios containing a wide variety of

technologies, DS M, and coal retirements

  • 75 stochastic production cost runs
  • Total of 9,000 iterations across all model runs
  • 1,500+ hours of model simulation time

2019 IRP S takeholder Meeting 12.9.19 34

slide-35
SLIDE 35

2019 IMPROVEMENTS

Modeling Tools and Analysis

  • Entirely new modeling platform with enhanced load, dispatch, renewable, storage, and stochastic

capabilities

  • Added power price basis analysis, which is especially important for wind
  • Revised scenario framework to allow more portfolio comparison across futures
  • Robust risk analysis, both quantitative and qualitative
  • Detailed EV and Distributed PV analysis
  • Overall improvement in data sharing, transparency, and visibility into modeling and analysis

Renewable Modeling

  • Robust development of wind and solar profiles
  • S
  • lar ELCC and net price shape analysis
  • Capital costs: transparent, multi-source cost estimates benchmarked to market bids
  • Improved storage modeling

2019 IRP S takeholder Meeting 12.9.19 35

slide-36
SLIDE 36

CANDIDATE RESOURCE PORTFOLIOS

2019 IRP S takeholder Meeting 12.9.19 36

(3,000) (2,000) (1,000) 1,000 2,000 3,000 4,000 5,000 6,000

1a 1b 1c 2a 2b 2c 3a 3b 3c 4a 4b 4c 5a 5b 5c Portfolio 1 Portfolio 2 Portfolio 3 Portfolio 4 Portfolio 5

Installed Capacity (MW)

Cumulative Installed Capacity Changes through 2039

DSM Wind Solar Storage Gas CC Gas CT Coal Gas Oil

slide-37
SLIDE 37

CAPEX REQUIREMENTS BY PORTFOLIO

2019 IRP S takeholder Meeting 12.9.19 37

$0.4 $0.6 $2.7 $4.4 $0.4 $0.5 $2.4 $3.9 $1.0 $1.3 $2.5 $3.3 $1.2 $2.7 $4.1 $5.2 $1.3 $3.6 $4.9 $5.8

2025 2030 2035 2039

Cumulative New Plant In Service (Nominal $Billion)

Portfolio 1 Portfolio 2 Portfolio 3 Portfolio 4 Portfolio 5 $- $1.0 $2.0 $3.0 $4.0 $5.0 $6.0 $7.0 $- $1.0 $2.0 $3.0 $4.0 $5.0 $6.0 $7.0

Cumulative New Plant In Service (Nominal $Billion)

Portfolio 1 Portfolio 2 Portfolio 3 Portfolio 4 Portfolio 5

slide-38
SLIDE 38

RESERVE MARGIN

2019 IRP S takeholder Meeting 12.9.19 38

0% 5% 10% 15% 20% 25%

UCAP Reserve Margin % (Base Load Forecast)

Portfolio 1 Portfolio 2 Portfolio 3 Portfolio 4 Portfolio 5

UCAP Reserve Margin Target ~7.2%

slide-39
SLIDE 39

PORTFOLIO METRICS

2019 IRP S takeholder Meeting 12.9.19 39

What is the impact on customer rates in the short term and long term?

COST

Consideration of air and water impacts

ENVIRONMENTAL

How much risk do the portfolios present to customers?

RISK IRP Metrics and Scorecard

slide-40
SLIDE 40

PVRR SUMMARY TABLE BY SCENARIO

Reference Case Scenario A: Carbon Tax Case Scenario B: Carbon + High Gas Scenario C: Carbon + Low Gas Scenario D: No Carbon + High Gas Portfolio 1a $7,215 $8,018 $8,427 $7,137 $7,923 Portfolio 2a $7,132 $7,932 $8,399 $7,017 $7,900 Portfolio 3a $7,016 $7,737 $8,211 $6,843 $7,798 Portfolio 4a $7,295 $7,740 $8,174 $6,922 $8,070 Portfolio 5a $7,500 $7,819 $8,329 $6,948 $8,376 Portfolio 1b $7,176 $7,950 $8,338 $7,087 $7,864 Portfolio 2b $7,188 $7,956 $8,398 $7,062 $7,932 Portfolio 3b $6,976 $7,661 $8,114 $6,786 $7,739 Portfolio 4b $7,293 $7,742 $8,191 $6,907 $8,082 Portfolio 5b $7,400 $7,703 $8,272 $6,769 $8,259 Portfolio 1c $7,223 $7,980 $8,355 $7,128 $7,899 Portfolio 2c $7,191 $7,923 $8,341 $7,051 $7,912 Portfolio 3c $7,034 $7,716 $8,165 $6,842 $7,794 Portfolio 4c $7,269 $7,747 $8,225 $6,883 $8,086 Portfolio 5c $7,452 $7,716 $8,202 $6,857 $8,306

2019 IRP S takeholder Meeting 12.9.19 40

20-Year PVRR ($MM)

slide-41
SLIDE 41

IDENTIFYING ROBUST PORTFOLIOS

Present Value Revenue Requirement ($Billion)

3b 3a 3c 2a 1b 2b 2c 1a 1c 4c 4b 4a 5b 5c 5a $6.6 $7.6

← Higher Cost Lower Cost →

Reference Case

3b 5b 3c 5c 3a 4a 4b 4c 5a 2c 2a 1b 2b 1c 1a $7.2 $8.1

Scenario A

3b 3c 4a 4b 5c 3a 4c 5b 5a 1b 2c 1c 2b 2a 1a $7.7 $8.5

Scenario B

5b 3b 3c 3a 5c 4c 4b 4a 5a 2a 2c 2b 1b 1c 1a $6.4 $7.2

Scenario C

3b 3c 3a 1b 1c 2a 2c 1a 2b 4a 4b 4c 5b 5c 5a $7.3 $8.5

Scenario D

2019 IRP S takeholder Meeting 12.9.19 41

Portfolio 1 Portfolio 2 Portfolio 3 Portfolio 4 Portfolio 5

slide-42
SLIDE 42

($200) ($150) ($100) ($50) $0 $50 $100 2020 2021 2022 2023 2024 2025 2026 2027 2028 2029 2030 2031 2032 2033 2034 2035 2036 2037 2038 2039

Annual Revenue Requirement ($MM)

Annual Difference from Portfolio 1b (Nominal $MM)

Portfolio 3b - Reference Case Portfolio 5b - Reference Case Portfolio 3b - Carbon Tax Case Portfolio 5b - Carbon Tax Case

SCENARIO A: CARBON TAX CASE

Present Value Revenue Requirement ($Billion)

3b 3a 3c 2a 1b 2b 2c 1a 1c 4c 4b 4a 5b 5c 5a $6.6 $7.6

← Higher Cost Lower Cost →

Reference Case

3b 5b 3c 5c 3a 4a 4b 4c 5a 2c 2a 1b 2b 1c 1a $7.2 $8.1

Scenario A

3b 3c 4a 4b 5c 3a 4c 5b 5a 1b 2c 1c 2b 2a 1a $7.7 $8.5

Scenario B

5b 3b 3c 3a 5c 4c 4b 4a 5a 2a 2c 2b 1b 1c 1a $6.4 $7.2

Scenario C

3b 3c 3a 1b 1c 2a 2c 1a 2b 4a 4b 4c 5b 5c 5a $7.3 $8.5

Scenario D

2019 IRP S takeholder Meeting 12.9.19 42

Portfolio 1 Portfolio 2 Portfolio 3 Portfolio 4 Portfolio 5 Carbon tax increases long term value of renewables

slide-43
SLIDE 43

($150) ($100) ($50) $0 $50 $100 2020 2021 2022 2023 2024 2025 2026 2027 2028 2029 2030 2031 2032 2033 2034 2035 2036 2037 2038 2039

Annual Revenue Requirement ($MM)

Annual Difference from Portfolio 1b (Nominal $MM)

Portfolio 3b - Reference Case Portfolio 4b - Reference Case Portfolio 5b - Reference Case Portfolio 3b - Scenario B Portfolio 4b - Scenario B Portfolio 5b - Scenario B

Present Value Revenue Requirement ($Billion)

3b 3a 3c 2a 1b 2b 2c 1a 1c 4c 4b 4a 5b 5c 5a $7.6

← →

erence Case

3b 5b 3c 5c 3a 4a 4b 4c 5a 2c 2a 1b 2b 1c 1a $7.2 $8.1

Scenario A

3b 3c 4a 4b 5c 3a 4c 5b 5a 1b 2c 1c 2b 2a 1a $7.7 $8.5

Scenario B

5b 3b 3c 3a 5c 4c 4b 4a 5a 2a 2c 2b 1b 1c 1a $6.4 $7.2

Scenario C

3b 3c 3a 1b 1c 2a 2c 1a 2b 4a 4b 4c 5b 5c 5a $7.3 $8.5

Scenario D

SCENARIO B: CARBON TAX + HIGH GAS

Present Value Revenue Requirement ($Billion)

3b 3a 3c 2a 1b 2b 2c 1a 1c 4c 4b 4a 5b 5c 5a $6.6 $7.6

← Higher Cost Lower Cost →

Reference Case

3b 5b 3c 5c 3a 4a 4b 4c 5a 2c 2a 1b 2b 1c 1a $7.2 $8.1

Scenario A

3b 3c 4a 4b 5c 3a 4c 5b 5a 1b 2c 1c 2b 2a 1a $7.7 $8.5

Scenario B

5b 3b 3c 3a 5c 4c 4b 4a 5a 2a 2c 2b 1b 1c 1a $6.4 $7.2

Scenario C

3b 3c 3a 1b 1c 2a 2c 1a 2b 4a 4b 4c 5b 5c 5a $7.3 $8.5

Scenario D

2019 IRP S takeholder Meeting 12.9.19 43

Portfolio 1 Portfolio 2 Portfolio 3 Portfolio 4 Portfolio 5

slide-44
SLIDE 44

Present Value Revenue Requirement ($Billion)

← →

3b 5b 3c 5c 3a 4a 4b 4c 5a 2c 2a 1b 2b 1c 1a $8.1

Scenario A

3b 3c 4a 4b 5c 3a 4c 5b 5a 1b 2c 1c 2b 2a 1a $7.7 $8.5

Scenario B

5b 3b 3c 3a 5c 4c 4b 4a 5a 2a 2c 2b 1b 1c 1a $6.4 $7.2

Scenario C

3b 3c 3a 1b 1c 2a 2c 1a 2b 4a 4b 4c 5b 5c 5a $7.3 $8.5

Scenario D

SCENARIO C: CARBON TAX + LOW GAS + LOW LOAD

Present Value Revenue Requirement ($Billion)

3b 3a 3c 2a 1b 2b 2c 1a 1c 4c 4b 4a 5b 5c 5a $6.6 $7.6

← Higher Cost Lower Cost →

Reference Case

3b 5b 3c 5c 3a 4a 4b 4c 5a 2c 2a 1b 2b 1c 1a $7.2 $8.1

Scenario A

3b 3c 4a 4b 5c 3a 4c 5b 5a 1b 2c 1c 2b 2a 1a $7.7 $8.5

Scenario B

5b 3b 3c 3a 5c 4c 4b 4a 5a 2a 2c 2b 1b 1c 1a $6.4 $7.2

Scenario C

3b 3c 3a 1b 1c 2a 2c 1a 2b 4a 4b 4c 5b 5c 5a $7.3 $8.5

Scenario D

2019 IRP S takeholder Meeting 12.9.19 44

Portfolio 1 Portfolio 2 Portfolio 3 Portfolio 4 Portfolio 5

($200) ($150) ($100) ($50) $0 $50 2020 2021 2022 2023 2024 2025 2026 2027 2028 2029 2030 2031 2032 2033 2034 2035 2036 2037 2038 2039

Annual Revenue Requirement ($MM)

Annual Difference from Portfolio 1b (Nominal $MM)

Portfolio 2a - Scenario C Portfolio 3b - Scenario C Portfolio 4b - Scenario C Portfolio 5b - Scenario C

slide-45
SLIDE 45

e Requirement ($Billion)

← →

3b 3c 4a 4b 5c 3a 4c 5b 5a 1b 2c 1c 2b 2a 1a $8.5

Scenario B

5b 3b 3c 3a 5c 4c 4b 4a 5a 2a 2c 2b 1b 1c 1a $6.4 $7.2

Scenario C

3b 3c 3a 1b 1c 2a 2c 1a 2b 4a 4b 4c 5b 5c 5a $7.3 $8.5

Scenario D

SCENARIO D: NO CARBON TAX + HIGH GAS + HIGH LOAD

Present Value Revenue Requirement ($Billion)

3b 3a 3c 2a 1b 2b 2c 1a 1c 4c 4b 4a 5b 5c 5a $6.6 $7.6

← Higher Cost Lower Cost →

Reference Case

3b 5b 3c 5c 3a 4a 4b 4c 5a 2c 2a 1b 2b 1c 1a $7.2 $8.1

Scenario A

3b 3c 4a 4b 5c 3a 4c 5b 5a 1b 2c 1c 2b 2a 1a $7.7 $8.5

Scenario B

5b 3b 3c 3a 5c 4c 4b 4a 5a 2a 2c 2b 1b 1c 1a $6.4 $7.2

Scenario C

3b 3c 3a 1b 1c 2a 2c 1a 2b 4a 4b 4c 5b 5c 5a $7.3 $8.5

Scenario D

2019 IRP S takeholder Meeting 12.9.19 45

Portfolio 1 Portfolio 2 Portfolio 3 Portfolio 4 Portfolio 5

$(60) $(40) $(20) $- $20 $40 $60 $80 $100 $120 2020 2021 2022 2023 2024 2025 2026 2027 2028 2029 2030 2031 2032 2033 2034 2035 2036 2037 2038 2039

Annual Revenue Requirement ($MM)

Annual Difference from Portfolio 1b (Nominal $MM)

Portfolio 2a - Scenario D Portfolio 3b - Scenario D Portfolio 4b - Scenario D Portfolio 5b - Scenario D

slide-46
SLIDE 46

PVRR TAKEAWAYS

  • Carbon tax single largest driver of changes in PVRR
  • Coal margins 40-50%

lower with carbon tax

  • Renewable captured revenue 30-40%

higher because of higher wholesale power prices

  • Reducing exposure to future carbon legislation important
  • Natural gas will continue to be a high impact variable as coal and

combined cycle units compete for positions in the dispatch stack

  • Benefits of portfolio diversity on display:
  • Portfolio 3, which moves toward a 30/ 40/ 30 mix of coal, natural gas, and

renewables, is the lowest cost across a range of futures

2019 IRP S takeholder Meeting 12.9.19 46

slide-47
SLIDE 47

RATE IMPACTS

Reference Case Scenario A: Carbon Tax Case Scenario B: Carbon + High Gas Scenario C: Carbon + Low Gas Scenario D: No Carbon + High Gas Portfolio 1a $0.503 $0.558 $0.586 $0.515 $0.529 Portfolio 2a $0.498 $0.552 $0.584 $0.506 $0.527 Portfolio 3a $0.490 $0.539 $0.572 $0.494 $0.521 Portfolio 4a $0.509 $0.539 $0.570 $0.500 $0.539 Portfolio 5a $0.523 $0.545 $0.581 $0.502 $0.559 Portfolio 1b $0.507 $0.560 $0.587 $0.518 $0.531 Portfolio 2b $0.507 $0.560 $0.591 $0.516 $0.535 Portfolio 3b $0.493 $0.540 $0.572 $0.496 $0.522 Portfolio 4b $0.515 $0.546 $0.578 $0.505 $0.545 Portfolio 5b $0.522 $0.543 $0.583 $0.495 $0.557 Portfolio 1c $0.515 $0.568 $0.595 $0.527 $0.538 Portfolio 2c $0.513 $0.564 $0.594 $0.521 $0.539 Portfolio 3c $0.502 $0.550 $0.582 $0.506 $0.531 Portfolio 4c $0.518 $0.552 $0.586 $0.509 $0.551 Portfolio 5c $0.531 $0.550 $0.585 $0.507 $0.566

2019 IRP S takeholder Meeting 12.9.19 47

Levelized Rate $/kWh

slide-48
SLIDE 48

RISK PREMIUM METRIC

2019 IRP S takeholder Meeting 12.9.19 48

The risk premium metric assesses the risk of high cost outcomes based on the stochastic results for each portfolio Taking the average of the

  • utcomes above the mean

captures tail risk better than P75

  • r P95
slide-49
SLIDE 49

RISK PREMIUM ($MM)

2019 IRP S takeholder Meeting 12.9.19 49

Reference Case Scenario A Scenario B Scenario C Scenario D Portfolio 1a $329 $383 $406 $353 $400 Portfolio 2a $370 $425 $465 $384 $452 Portfolio 3a $367 $419 $464 $370 $448 Portfolio 4a $466 $537 $611 $466 $554 Portfolio 5a $441 $498 $574 $431 $539 Portfolio 1b $358 $420 $447 $385 $430 Portfolio 2b $354 $407 $442 $363 $431 Portfolio 3b $408 $468 $532 $415 $495 Portfolio 4b $461 $534 $609 $467 $554 Portfolio 5b $493 $565 $649 $481 $595 Portfolio 1c $348 $406 $430 $374 $416 Portfolio 2c $360 $412 $449 $368 $438 Portfolio 3c $372 $424 $476 $378 $448 Portfolio 4c $457 $534 $612 $464 $554 Portfolio 5c $442 $507 $584 $448 $543

  • Risk premiums are 4-

7%

  • f total cost
  • Risk premium lowest

for Portfolios 1 and 2

  • Coal prices relatively

stable, dispatchability improves economics

  • High renewable

portfolios can create mismatch between load and generation

slide-50
SLIDE 50

RISK-ADJUSTED PVRR ($MM)

Reference Case Scenario A Scenario B Scenario C Scenario D Portfolio 1a $7,544 $8,401 $8,833 $7,489 $8,324 Portfolio 2a $7,502 $8,356 $8,865 $7,401 $8,351 Portfolio 3a $7,383 $8,156 $8,676 $7,213 $8,246 Portfolio 4a $7,761 $8,278 $8,784 $7,388 $8,623 Portfolio 5a $7,941 $8,317 $8,904 $7,379 $8,915 Portfolio 1b $7,533 $8,370 $8,785 $7,472 $8,294 Portfolio 2b $7,542 $8,363 $8,840 $7,425 $8,363 Portfolio 3b $7,384 $8,129 $8,646 $7,201 $8,234 Portfolio 4b $7,754 $8,277 $8,800 $7,374 $8,636 Portfolio 5b $7,892 $8,268 $8,921 $7,250 $8,854 Portfolio 1c $7,571 $8,387 $8,785 $7,502 $8,315 Portfolio 2c $7,551 $8,335 $8,791 $7,418 $8,350 Portfolio 3c $7,407 $8,139 $8,642 $7,221 $8,242 Portfolio 4c $7,726 $8,281 $8,837 $7,347 $8,640 Portfolio 5c $7,893 $8,223 $8,786 $7,305 $8,849

2019 IRP S takeholder Meeting 12.9.19 50

  • Adding risk premium

to expected value PVRR puts all portfolios on level playing field

  • Portfolio 3 is lowest

cost on a risk- adjusted basis in all scenarios

slide-51
SLIDE 51

PVRR WITH RISK DISTRIBUTIONS: REFERENCE CASE

2019 IRP S takeholder Meeting 12.9.19 51

3b 3a 3c 2a 1b 2b 2c 1a 1c 4c 4b 4a 5b 5c 5a $6,000 $6,500 $7,000 $7,500 $8,000 $8,500

20-Year PVRR ($MM)

PVRR Range: Reference Case

Downside Potential Risk Premium Expected Value (Mean)

slide-52
SLIDE 52

PVRR WITH RISK DISTRIBUTIONS: SCENARIO A (CARBON TAX CASE)

2019 IRP S takeholder Meeting 12.9.19 52

3b 5b 3c 5c 3a 4a 4b 4c 5a 2c 2a 1b 2b 1c 1a $6,500 $7,000 $7,500 $8,000 $8,500 $9,000

20-Year PVRR ($MM)

PVRR Range: Scenario A (Carbon Tax Case)

Downside Potential Risk Premium Expected Value (Mean)

slide-53
SLIDE 53

RISK METRIC: MARKET INTERACTION

2019 IRP S takeholder Meeting 12.9.19 53

July 27 July 28 July 29

500 1,000 1,500 2,000 2,500 3,000

MW

Solar Wind Eagle Valley CCGT Coal Harding Street Gas Georgetown Gas IPL System Load

Market Purchases Market Sales

  • Looking only at annual

energy misses the act ual market interaction that will occur hourly

  • Market purchases and

sales occur in all portfolios

  • Relying too heavily on

market purchases introduces risk

  • Relying on value from

market sales is equally risky

slide-54
SLIDE 54

RELIANCE ON THE MARKET: BALANCED APPROACH

2019 IRP S takeholder Meeting 12.9.19 54

Market Interaction

(in Millions of MWh)

| Purchases| + | S ales| Reference Case Portfolio 1b 5.2 3b 5.0 5b 5.6 S cenario A: Carbon Case Portfolio 1b 5.7 3b 5.4 5b 5.6

Reference Case S cenario A: Carbon Case

Portfolio 1 vs. Portfolio 3 Portfolio 1 vs. Portfolio 5

slide-55
SLIDE 55

ENVIRONMENTAL: AIR EMISSIONS

2019 IRP S takeholder Meeting 12.9.19 55

CO2 (million short-tons) CO2 Intensity (short- tons/MWh) NOx (short-tons) SO2 (short-tons) 2010 - 2012 Baseline (3-year average) 16.1 1.05 14,255 53,107 20-Year Average (2020 - 2039) Portfolio 1a 11.9 0.75 8,028 10,972 Portfolio 2a 11.0 0.73 7,120 10,477 Portfolio 3a 9.5 0.64 6,371 9,577 Portfolio 4a 7.0 0.46 5,152 6,038 Portfolio 5a 5.6 0.38 2,991 3,582 Portfolio 1b 11.9 0.74 8,028 10,972 Portfolio 2b 11.1 0.72 7,124 10,477 Portfolio 3b 9.5 0.63 6,371 9,577 Portfolio 4b 7.0 0.47 5,164 6,039 Portfolio 5b 5.8 0.41 3,014 3,583 Portfolio 1c 11.9 0.74 8,028 10,972 Portfolio 2c 11.0 0.71 7,120 10,477 Portfolio 3c 9.5 0.64 6,371 9,577 Portfolio 4c 7.1 0.49 5,182 6,039 Portfolio 5c 5.7 0.38 2,988 3,583 CO2 (million short-tons) CO2 Intensity (short- tons/MWh) NOx (short-tons) SO2 (short-tons) 2010 - 2012 Baseline (3-year average) 16.1 1.05 14,255 53,107 Portfolio 1a 10.0 0.71 6,547 8,653 Portfolio 2a 9.3 0.69 5,722 8,203 Portfolio 3a 8.0 0.59 5,085 7,438 Portfolio 4a 6.3 0.43 4,265 5,059 Portfolio 5a 5.6 0.38 2,952 3,552 Portfolio 1b 10.0 0.70 6,547 8,653 Portfolio 2b 9.3 0.68 5,726 8,203 Portfolio 3b 8.0 0.58 5,085 7,438 Portfolio 4b 6.3 0.44 4,277 5,059 Portfolio 5b 5.8 0.41 2,974 3,553 Portfolio 1c 10.0 0.70 6,547 8,653 Portfolio 2c 9.3 0.67 5,722 8,203 Portfolio 3c 8.0 0.59 5,085 7,438 Portfolio 4c 6.4 0.46 4,294 5,060 Portfolio 5c 5.7 0.38 2,950 3,552

Reference Case Scenario A: Carbon Tax Case

slide-56
SLIDE 56

ENVIRONMENTAL: NON-AIR IMPACTS

2019 IRP S takeholder Meeting 12.9.19 56

  • Impact of coal retirements on water:
  • Retire Units 1 and 2: significant reduction in actual intake flow

(estimate: greater than 67% );

  • Retire Units 1-4 (assume no water withdrawal): result in the

elimination of 354 million gallons per day (MGD) (100% reduction) of water withdraw from the river

slide-57
SLIDE 57

PORTFOLIO METRICS SUMMARY

Cost

  • Portfolio 3b is the

lowest cost portfolio across wide range scenarios

  • O&M and Capex

savings from retirements mitigates rate impacts of cost

  • f new capacity

Risk

  • Portfolio 3b lowest

cost on risk-adj usted basis

  • Portfolio 3b resource

mix provides balanced energy and load profile and reduction total market interaction Environmental

  • Portfolio 3b benefits:
  • Near term

reductions in CO2, NOx, S O2

  • 60-70%

reduction in water intake flow at the plant

2019 IRP S takeholder Meeting 12.9.19 57

slide-58
SLIDE 58

LUNCH BREAK

2019 IRP S takeholder Meeting 12.9.19 58

slide-59
SLIDE 59

SENSITIVITY ANALYSIS

Patrick Maguire

Direct or of Resource Planning, IPL

2019 IRP S takeholder Meeting 12.9.19 59

slide-60
SLIDE 60

SENSITIVITY ANALYSIS

  • Sensitivity: change of a single variable to isolate the impact of

future uncertainty

  • Four deterministic analyses conducted:

1. Capital Costs for wind, solar, and storage 2. MIS O Capacity Prices 3. Wind Capacity Factor 4. Wind LMP Basis

2019 IRP S takeholder Meeting 12.9.19 60

slide-61
SLIDE 61

CAPITAL COST SENSITIVITY (1 OF 4)

2019 IRP S takeholder Meeting 12.9.19 61

+20% +30% +50% +10% +15% +25%

  • 10%
  • 15%
  • 25%
  • 20%
  • 30%
  • 50%

$0 $500 $1,000 $1,500 $2,000 $2,500

Wind Capital Cost (2018$/kW, includes PTC and AFUDC)

High and low capital cost ranges established for wind, solar, and storage

slide-62
SLIDE 62

CAPITAL COST SENSITIVITY (2 OF 4)

2019 IRP S takeholder Meeting 12.9.19 62

+20% +30% +50% +10% +15% +25%

  • 10%
  • 15%
  • 25%
  • 20%
  • 30%
  • 50%

$0 $500 $1,000 $1,500 $2,000 $2,500

Wind Capital Cost (2018$/kW, includes PTC and AFUDC)

+20% +30% +50% +10% +15% +25%

  • 10%
  • 15%
  • 25%
  • 20%
  • 30%
  • 50%

$0 $200 $400 $600 $800 $1,000 $1,200

Solar Capital Cost (2018$/kWAC, includes ITC and AFUDC)

+20% +30% +50% +10% +15% +25%

  • 10%
  • 15%
  • 25%
  • 20%
  • 30%
  • 50%

$0 $200 $400 $600 $800 $1,000 $1,200 $1,400

Battery Storage Cost (2018$/kW, includes AFUDC)

  • Wind, solar, and storage cost

sensitivities applied to fixed portfolios

  • All three costs moved

together

slide-63
SLIDE 63

CAPITAL COST SENSITIVITY (3 OF 4)

2019 IRP S takeholder Meeting 12.9.19 63

  • 30%
  • 15%

+15% +30% Portfolio 3b $6,775 $6,874 $6,976 $7,077 $7,177 Portfolio 3a $6,841 $6,927 $7,016 $7,105 $7,191 Portfolio 3c $6,843 $6,938 $7,034 $7,131 $7,225 Portfolio 2a $6,965 $7,049 $7,132 $7,214 $7,298 Portfolio 1b $7,004 $7,091 $7,176 $7,261 $7,348 Portfolio 2b $7,010 $7,100 $7,188 $7,276 $7,366 Portfolio 2c $6,986 $7,089 $7,191 $7,292 $7,396 Portfolio 1a $7,043 $7,130 $7,215 $7,300 $7,387 Portfolio 1c $7,043 $7,134 $7,223 $7,312 $7,403 Portfolio 4c $6,978 $7,121 $7,269 $7,417 $7,560 Portfolio 4b $6,928 $7,107 $7,293 $7,478 $7,658 Portfolio 4a $6,912 $7,100 $7,295 $7,490 $7,678 Portfolio 5b $7,073 $7,234 $7,400 $7,565 $7,726 Portfolio 5c $7,001 $7,224 $7,452 $7,679 $7,902 Portfolio 5a $7,100 $7,309 $7,500 $7,741 $7,950 Percent Change by 2030 PVRR w/ Base Capital Costs ↓ Percent Change by 2030

Reference Case PVRR ($MM)

1 1

Portfolio 3b lowest cost with a 30% reduction from base cost forecasts for wind, solar, and storage

2

Portfolio 3b lowest cost with a significant increase in capital costs for wind, solar, and storage

2

Takeaways:

slide-64
SLIDE 64
  • 30%
  • 15%

+15% +30% Portfolio 3b $7,460 $7,560 $7,661 $7,763 $7,862 Portfolio 5b $7,377 $7,538 $7,703 $7,869 $8,030 Portfolio 3c $7,524 $7,619 $7,716 $7,812 $7,907 Portfolio 5c $7,266 $7,489 $7,716 $7,944 $8,166 Portfolio 3a $7,562 $7,648 $7,737 $7,826 $7,912 Portfolio 4a $7,357 $7,546 $7,740 $7,935 $8,123 Portfolio 4b $7,377 $7,538 $7,742 $7,928 $8,107 Portfolio 4c $7,456 $7,599 $7,747 $7,896 $8,039 Portfolio 5a $7,394 $7,603 $7,819 $8,035 $8,244 Portfolio 2c $7,719 $7,822 $7,923 $8,025 $8,128 Portfolio 2a $7,765 $7,849 $7,932 $8,014 $8,098 Portfolio 1b $7,778 $7,865 $7,950 $8,035 $8,122 Portfolio 2b $7,778 $7,868 $7,956 $8,044 $8,134 Portfolio 1c $7,800 $7,891 $7,980 $8,069 $8,160 Portfolio 1a $7,846 $7,933 $8,018 $8,103 $8,190 PVRR w/ Base Capital Costs ↓ Percent Change by 2030 Percent Change by 2030

CAPITAL COST SENSITIVITY (4 OF 4)

2019 IRP S takeholder Meeting 12.9.19 64

Scenario A (Carbon Tax Case) PVRR ($MM)

1

Portfolio 5 becomes lowest cost with (a) federal price on carbon and (b) cost declines (from base forecast) in wind, solar, and storage Portfolio 3b lowest cost with a significant increase in capital costs for wind, solar, and storage

2

Carbon Tax Case Results:

2 1

slide-65
SLIDE 65

MISO CAPACITY PRICE SENSITIVITY (1 OF 3)

2019 IRP S takeholder Meeting 12.9.19 65

$0 $50 $100 $150 $200 $250 $300 $350 $0 $50 $100 $150 $200 $250 $300 $350

Nominal $/MW-day

Floor: 5% of Fundamental/CONE Mode: 25% of Fundamental/CONE Ceiling: 60% of Fundamental/CONE Average of Floor, Mode, Ceiling

MISO Zone 6 Modeled Capacity Prices

  • MIS

O capacity prices applied to portfolio position imbalances (long/ short)

  • Greatest impact on Portfolios 1

and 2 because IPL is in a net long capacity position today

  • Capacity prices modeled

stochastically to capture range

  • f uncertainty
  • Deterministic sensitivities

conducted to measure impact of capacity prices on PVRR results

Stochastic Range

slide-66
SLIDE 66

[Base] Bilateral Floor Bilateral Most Likely Stochastic Mean ↓ Bilateral Ceiling CONE Portfolio 3b $6,983 $6,978 $6,976 $6,966 $6,953 Portfolio 3a $7,024 $7,018 $7,016 $7,006 $6,993 Portfolio 3c $7,034 $7,034 $7,034 $7,034 $7,034 Portfolio 2a $7,146 $7,136 $7,132 $7,113 $7,087 Portfolio 1b $7,221 $7,190 $7,176 $7,116 $7,035 Portfolio 2b $7,203 $7,193 $7,188 $7,169 $7,144 Portfolio 2c $7,191 $7,191 $7,191 $7,191 $7,191 Portfolio 1a $7,260 $7,229 $7,215 $7,156 $7,074 Portfolio 1c $7,223 $7,223 $7,223 $7,223 $7,223 Portfolio 4c $7,269 $7,269 $7,269 $7,269 $7,269 Portfolio 4b $7,301 $7,295 $7,293 $7,281 $7,267 Portfolio 4a $7,304 $7,298 $7,295 $7,284 $7,269 Portfolio 5b $7,408 $7,402 $7,400 $7,389 $7,375 Portfolio 5c $7,452 $7,452 $7,452 $7,452 $7,452 Portfolio 5a $7,508 $7,503 $7,500 $7,489 $7,475

MISO CAPACITY PRICE SENSITIVITY (2 OF 2)

2019 IRP S takeholder Meeting 12.9.19 66

Reference Case PVRR ($MM)

1

Portfolio 3b lowest cost even with applying CONE capacity price to capacity length in Portfolios 1 and 2

Reference Case Results:

2

S ustained low capacity prices increases value of Portfolio 3 relative to Portfolios 1 and 2

2 1

slide-67
SLIDE 67

WIND CAPACITY FACTOR (1 OF 3)

2019 IRP S takeholder Meeting 12.9.19 67

Calendar year 2018 capacity factors by region: 2014–2017 projects only

DOE 2018 Wind Technologies Market Report (PDF)

  • IPL utilized the NREL Wind Toolkit to source generic hourly wind profiles
  • Capacity factor sensitivity evaluates PVRR impact of lower actual wind

production compared to modeled

  • Captured revenue “locked” from base, MWh adjusted

S

  • urce: NREL
slide-68
SLIDE 68

46% 44% Base (42%) ↓ 40% 38% 36% 34% 32% 30% Portfolio 3b $6,959 $6,968 $6,976 $6,987 $6,996 $7,005 $7,014 $7,024 $7,033 Portfolio 3a $6,991 $7,004 $7,016 $7,032 $7,046 $7,059 $7,073 $7,087 $7,101 Portfolio 3c $7,012 $7,024 $7,034 $7,049 $7,061 $7,073 $7,086 $7,098 $7,110 Portfolio 2a $7,128 $7,130 $7,132 $7,134 $7,136 $7,138 $7,140 $7,142 $7,144 Portfolio 1b $7,172 $7,174 $7,176 $7,178 $7,180 $7,182 $7,184 $7,186 $7,187 Portfolio 2b $7,179 $7,184 $7,188 $7,194 $7,199 $7,203 $7,208 $7,213 $7,218 Portfolio 2c $7,180 $7,186 $7,191 $7,198 $7,204 $7,210 $7,215 $7,221 $7,227 Portfolio 1a $7,208 $7,212 $7,215 $7,219 $7,223 $7,227 $7,230 $7,234 $7,238 Portfolio 1c $7,217 $7,221 $7,223 $7,227 $7,230 $7,233 $7,237 $7,240 $7,243 Portfolio 4c $7,222 $7,248 $7,269 $7,299 $7,325 $7,350 $7,376 $7,401 $7,427 Portfolio 4b $7,234 $7,266 $7,293 $7,330 $7,362 $7,394 $7,426 $7,458 $7,489 Portfolio 4a $7,228 $7,265 $7,295 $7,338 $7,375 $7,411 $7,448 $7,484 $7,521 Portfolio 5b $7,355 $7,379 $7,400 $7,428 $7,453 $7,477 $7,502 $7,526 $7,551 Portfolio 5c $7,372 $7,416 $7,452 $7,503 $7,546 $7,589 $7,633 $7,676 $7,720 Portfolio 5a $7,417 $7,461 $7,500 $7,549 $7,593 $7,638 $7,682 $7,726 $7,770

WIND CAPACITY FACTOR (2 OF 3)

2019 IRP S takeholder Meeting 12.9.19 68

Reference Case Results: Reference Case PVRR ($MM)

Wind annual capacity factor →

1

Very low capacity factor for wind does not change lowest cost portfolio in Reference Case

1 2

Every 2% decrease in annual net capacity factor for wind increases Portfolio 5 PVRR by ~$43M, or 1%

2

slide-69
SLIDE 69

46% 44% Base (42%) ↓ 40% 38% 36% 34% 32% 30% Portfolio 3b $7,640 $7,652 $7,661 $7,675 $7,686 $7,698 $7,709 $7,721 $7,733 Portfolio 5b $7,649 $7,679 $7,703 $7,739 $7,769 $7,798 $7,828 $7,858 $7,888 Portfolio 3c $7,688 $7,703 $7,716 $7,733 $7,748 $7,764 $7,779 $7,794 $7,809 Portfolio 5c $7,619 $7,672 $7,716 $7,779 $7,832 $7,886 $7,939 $7,993 $8,046 Portfolio 3a $7,707 $7,723 $7,737 $7,756 $7,772 $7,789 $7,805 $7,822 $7,838 Portfolio 4a $7,659 $7,704 $7,740 $7,793 $7,837 $7,881 $7,926 $7,970 $8,015 Portfolio 4b $7,671 $7,710 $7,742 $7,788 $7,827 $7,867 $7,906 $7,945 $7,984 Portfolio 4c $7,691 $7,722 $7,747 $7,784 $7,815 $7,845 $7,876 $7,907 $7,938 Portfolio 5a $7,718 $7,772 $7,819 $7,879 $7,933 $7,986 $8,040 $8,094 $8,148 Portfolio 2c $7,909 $7,917 $7,923 $7,933 $7,941 $7,949 $7,958 $7,966 $7,974 Portfolio 2a $7,927 $7,929 $7,932 $7,935 $7,937 $7,940 $7,943 $7,946 $7,948 Portfolio 1b $7,945 $7,948 $7,950 $7,953 $7,956 $7,959 $7,961 $7,964 $7,967 Portfolio 2b $7,944 $7,950 $7,956 $7,964 $7,970 $7,977 $7,983 $7,990 $7,996 Portfolio 1c $7,972 $7,977 $7,980 $7,985 $7,990 $7,994 $7,999 $8,003 $8,008 Portfolio 1a $8,009 $8,014 $8,018 $8,024 $8,029 $8,034 $8,039 $8,044 $8,050

WIND CAPACITY FACTOR (3 OF 3)

2019 IRP S takeholder Meeting 12.9.19 69

Carbon Tax Case Results: Scenario A (Carbon Tax Case) PVRR ($MM)

Wind annual capacity factor →

1

Portfolio 3b still lowest cost in Carbon Tax case.

1 2

Lower realized capacity factor for wind moves Portfolio 4 ahead of 5; Portfolio 3 still lowest cost

2

slide-70
SLIDE 70

WIND LMP BASIS/CAPTURED REVENUE (1 OF 3)

  • Congestion, due to transmission constraints, outages, and other

factors, results in price separation from generator to IPL load

  • LMP basis to MIS

O Indiana Hub applied to existing and new resources to account for congestion impacts on nodal LMPs

  • S

ensitivity analysis designed to evaluate the impact of removing that LMP discount for wind

  • Wind production (MWh) locked and fixed across portfolios
  • Captured revenue increased in 5%

increments to remove LMP discount

2019 IRP S takeholder Meeting 12.9.19 70

slide-71
SLIDE 71

WIND LMP BASIS/CAPTURED REVENUE (2 OF 3)

2019 IRP S takeholder Meeting 12.9.19 71

Reference Case PVRR ($MM)

Base Revenue +5% Revenue +10% Revenue +15% Revenue +20% Portfolio 3b $6,976 $6,966 $6,956 $6,946 $6,937 Portfolio 3a $7,016 $7,001 $6,987 $6,972 $6,958 Portfolio 3c $7,034 $7,021 $7,008 $6,995 $6,982 Portfolio 2a $7,132 $7,130 $7,128 $7,126 $7,124 Portfolio 1b $7,176 $7,174 $7,172 $7,170 $7,168 Portfolio 2b $7,188 $7,183 $7,178 $7,173 $7,168 Portfolio 2c $7,191 $7,185 $7,178 $7,172 $7,166 Portfolio 1a $7,215 $7,211 $7,207 $7,203 $7,199 Portfolio 1c $7,223 $7,220 $7,216 $7,213 $7,210 Portfolio 4c $7,269 $7,242 $7,215 $7,188 $7,161 Portfolio 4b $7,293 $7,259 $7,225 $7,191 $7,158 Portfolio 4a $7,295 $7,256 $7,218 $7,179 $7,140 Portfolio 5b $7,400 $7,374 $7,348 $7,322 $7,296 Portfolio 5c $7,452 $7,406 $7,360 $7,314 $7,268 Portfolio 5a $7,500 $7,453 $7,407 $7,360 $7,314

1

Removing the LMP basis on wind closes the gap between Portfolio 5 and Portfolio 3 by ~$124M; Portfolio 3 still lowest cost

Reference Case Results:

1

slide-72
SLIDE 72

Base Revenue +5% Revenue +10% Revenue +15% Revenue +20% Portfolio 3b $7,661 $7,649 $7,637 $7,625 $7,612 Portfolio 5b $7,703 $7,672 $7,640 $7,608 $7,576 Portfolio 3c $7,716 $7,699 $7,683 $7,667 $7,651 Portfolio 5c $7,716 $7,660 $7,603 $7,547 $7,490 Portfolio 3a $7,737 $7,720 $7,702 $7,685 $7,668 Portfolio 4a $7,740 $7,693 $7,646 $7,599 $7,552 Portfolio 4b $7,742 $7,701 $7,659 $7,618 $7,576 Portfolio 4c $7,747 $7,715 $7,682 $7,649 $7,616 Portfolio 5a $7,819 $7,763 $7,706 $7,649 $7,593 Portfolio 2c $7,923 $7,915 $7,906 $7,898 $7,889 Portfolio 2a $7,932 $7,929 $7,926 $7,923 $7,920 Portfolio 1b $7,950 $7,947 $7,944 $7,941 $7,939 Portfolio 2b $7,956 $7,949 $7,942 $7,935 $7,928 Portfolio 1c $7,980 $7,976 $7,971 $7,966 $7,961 Portfolio 1a $8,018 $8,013 $8,007 $8,002 $7,996

WIND LMP BASIS/CAPTURED REVENUE (3 OF 3)

2019 IRP S takeholder Meeting 12.9.19 72

Scenario A (Carbon Tax Case) PVRR ($MM)

1

Improved congestion, and therefore revenue, for wind increases value of Portfolio 5 compared to Portfolio 3 with a federal price on carbon

Carbon Tax Case Results:

1

slide-73
SLIDE 73

PREFERRED RESOURCE PORTFOLIO & SHORT TERM ACTION PLAN

Patrick Maguire

Direct or of Resource Planning, IPL

2019 IRP S takeholder Meeting 12.9.19 73

slide-74
SLIDE 74

PREFERRED PORTFOLIO

  • Portfolio 3b:
  • Least cost portfolio on a risk-adj usted

basis across a wide range of futures

  • Retirement of Pete 1 and 2 lowest cost

when stressing capacity value, cost of replacement capacity, and value of replacement capacity

  • Preserve flexibility and optionality in

the face of uncertainty over the next 3-5 years

2019 IRP S takeholder Meeting 12.9.19 74

207 500 1,000 1,500 2,000 2,500 3,000 3,500 2020 2021 2022 2023

IPL Firm Capacity Position (UCAP MW)

Coal Natural Gas Other Capacity Shortfall Load + Reserve Margin

+407 +184 +168

slide-75
SLIDE 75

PREFERRED PORTFOLIO

2019 IRP S takeholder Meeting 12.9.19 75

207 500 1,000 1,500 2,000 2,500 3,000 3,500 2020 2021 2022 2023

IPL Firm Capacity Position (UCAP MW)

Coal Natural Gas Other Capacity Shortfall Load + Reserve Margin

+407 +184 +168

Model indicating that lowest cost portfolio fills capacity shortfall with a combination of wind, solar, storage, and DSM ~200 MW of firm capacity =

Portfolio 3a Portfolio 3b Portfolio 3c Wind 250 100 150 S

  • lar

375 450 400 S torage 40 20 Total ICAP MW 665 550 570

Actual mix will be influenced by bids received in all-source RFP

slide-76
SLIDE 76

ALL-SOURCE RFP

  • S

argent & Lundy contracted to run competitively bid, all-source RFP

  • More detail will be

released in the upcoming weeks

  • All information will

be hosted at iplpower.com/ RFP

2019 IRP S takeholder Meeting 12.9.19 76

1,230 200 200 640 2,772 3,178 1,880

150 685 1,497 54 607 1,000 2,000 3,000 4,000 5,000 6,000 2020 2021 2022 2023

Wind Solar Battery Storage Hybrid Gas

Annual MW by In-Service Year

Source Data: MISO Generat ion Int econnection Queue as of 11/ 10/ 2019 1,630 13% 8,470 65% 835 6% 1,497 11% 661 5%

Total by 2023: 13,093 MW

MISO Generation Interconnection Queue: Indiana Projects

slide-77
SLIDE 77

DSM ACTION PLAN 2021 – 2023

  • IPL will target the level of DS

M included in Decrement 4 (Ref Case)

  • Decrement 4 is equivalent to roughly 1%
  • f sales
  • Residential general service LEDs will no longer be offered in 2021 – 2023 due

to lighting baseline change

  • Currently lighting makes up 40%
  • f Residential savings
  • Change possibly eliminates some Residential programs
  • General service LEDs will still be available to income qualified customers

2019 IRP S takeholder Meeting 12.9.19 77

2021 2022 2023 Decrements 1 - 3 (Gross MWh) 116,376 112,403 113,197 Decrements 1 - 4 (Gross MWh) * 144,890 146,158 146,490 DSM Action Plan Target (Gross MWh) 116,376 - 144,890 112,403 - 146,158 113,197 - 146,490

*DSM level in Reference Case

slide-78
SLIDE 78

FUTURE MODELING ENHANCEMENTS

Previous IPL IRPs

  • Annual Reserve Margin Target based
  • n S

ummer Peak

  • “Typical week” capacity expansion
  • Deterministic view with a single

normalized set of load, price, and renewable shapes

  • Fixed capacity values for renewables
  • Cursory look at electric vehicle and

distributed solar 2019 IPL IRP

  • Annual Reserve Margin Target based
  • n S

ummer Peak

  • Hourly chronological capacity

expansion with stochastic weather, load, and commodity prices

  • S
  • lar ELCC considerations through

time

  • Hourly stochastic variations in

weather with an integrated weather-load-price-renewable model

  • Top down annual electric vehicle

and distributed solar forecasts at the system level Considerations for Future IRPs

  • S

easonal capacity assessment

  • Hourly and sub-hourly modeling
  • DS

M, EE, and DR shapes modeled hourly and sub-hourly to assess peak reduction, load shifting value

  • Dynamic wind, solar, and storage

ELCC

  • Bottom up electric vehicle and

distributed solar forecast integrated with generation, transmission, and distribution planning

  • S

cenario planning centered around decarbonization pathways that prioritize least cost, reliability, and effectiveness

78

Renewables and storage introduce complexity in the market and fundamentally change the type of modeling required for long-term resource planning

slide-79
SLIDE 79

CONCLUDING REMARKS

Vince Parisi

President and CEO, IPL

2019 IRP S takeholder Meeting 12.9.19 79

slide-80
SLIDE 80

APPENDIX

2019 IRP S takeholder Meeting 12.9.19 80

slide-81
SLIDE 81

ACRONYM LIST

Acronym Name CCGT/CC Combined Cycle ST S team Turbine CT Combustion Turbine UCAP Unforced Capacity ICAP Installed Capacity PRMR Planning Reserve Margin Requirement ELCC Effective Load Carrying Capability DR Demand Response DSM Demand S ide Management MISO Midcontinent Independent S ystem Operator 81 Acronym Name RFP Request for Proposals LCOE Levelized Cost of Energy LMP Locational Marginal Price PPA Power Purchase Agreement PTC Production Tax Credit ITC Investment Tax Credit CONE Cost of New Entry NREL National Renewable Energy Laboratory RIIA Renewable Integration Impact Assessment PVRR Present Value Revenue Requirement

slide-82
SLIDE 82

PORTFOLIO 1 ICAP CHANGES

2019 IRP S takeholder Meeting 12.9.19 82

Portfolio 1a: Includes Decrements 1-3

Resource Type 2020 2021 2022 2023 2024 2025 2026 2027 2028 2029 2030 2031 2032 2033 2034 2035 2036 2037 2038 2039 ■ New DSM 18 33 49 64 80 97 114 128 143 157 171 183 194 205 215 216 219 220 223 ■ New Wind 100 100 100 100 250 250 700 ■ New Solar 425 475 875 950 1,025 1,175 1,175 ■ New Battery Storage 100 200 500 520 520 560 560 ■ New Gas CC 325 325 325 325 325 325 ■ New Gas CT

Portfolio 1b: Includes Decrements 1-4

Resource Type 2020 2021 2022 2023 2024 2025 2026 2027 2028 2029 2030 2031 2032 2033 2034 2035 2036 2037 2038 2039 ■ New DSM 23 44 63 83 103 124 143 162 181 199 215 230 244 257 271 276 282 288 293 ■ New Wind 150 150 550 ■ New Solar 500 900 1,375 1,375 1,450 1,450 1,450 ■ New Battery Storage 40 40 320 360 360 440 440 ■ New Gas CC 325 325 325 325 325 325 ■ New Gas CT

Portfolio 1c: Includes Decrements 1-5

Resource Type 2020 2021 2022 2023 2024 2025 2026 2027 2028 2029 2030 2031 2032 2033 2034 2035 2036 2037 2038 2039 ■ New DSM 28 50 73 97 120 145 170 191 212 235 252 269 288 303 319 326 332 338 347 ■ New Wind 100 100 250 400 550 ■ New Solar 500 825 1,250 1,325 1,325 1,425 1,425 ■ New Battery Storage 20 300 320 340 380 400 ■ New Gas CC 325 325 325 325 325 325 ■ New Gas CT

Retirements in All Portfolio 1 Runs

Resource Type 2020 2021 2022 2023 2024 2025 2026 2027 2028 2029 2030 2031 2032 2033 2034 2035 2036 2037 2038 2039 Coal

  • 220
  • 220
  • 630
  • 630
  • 630
  • 630
  • 630

Gas

  • 200
  • 200
  • 200
  • 200
  • 620
  • 620
  • 620
  • 620
  • 620
  • 620

Oil

  • 40
  • 40
  • 40
  • 40
  • 40
  • 40
  • 40
  • 40
  • 40
  • 40
  • 40
  • 40
  • 40
  • 40
  • 40
  • 40

(630) (630) (630) (620) (620) (620) (40) (40) (40) 223 293 347 700 550 550 1,175 1,450 1,425 560 440 400 325 325 325 (2,000) (1,500) (1,000) (500) 500 1,000 1,500 2,000 2,500 3,000 3,500 Portfolio 1a Portfolio 1b Portfolio 1c

Installed Capacity (MW)

Cumulative ICAP Changes through 2039

Coal Natural Gas Oil DSM Wind Solar Storage Gas CC Gas CT

slide-83
SLIDE 83

PORTFOLIO 2 ICAP CHANGES

2019 IRP S takeholder Meeting 12.9.19 83

(630) (630) (630) (620) (620) (620) (40) (40) (40) 223 293 347 400 500 750 1,425 1,300 1,275 520 380 420 325 325 325 100 (2,000) (1,500) (1,000) (500) 500 1,000 1,500 2,000 2,500 3,000 3,500 Portfolio 2a Portfolio 2b Portfolio 2c

Installed Capacity (MW)

Cumulative ICAP Changes through 2039

Coal Natural Gas Oil DSM Wind Solar Storage Gas CC Gas CT Portfolio 2a: Includes Decrements 1-3

Resource Type 2020 2021 2022 2023 2024 2025 2026 2027 2028 2029 2030 2031 2032 2033 2034 2035 2036 2037 2038 2039 ■ New DSM 18 33 49 64 80 97 114 128 143 157 171 183 194 205 215 216 219 220 223 ■ New Wind 100 350 400 ■ New Solar 125 125 175 500 900 1,050 1,150 1,375 1,425 ■ New Battery Storage 160 180 180 200 500 500 500 500 520 ■ New Gas CC 325 325 325 325 325 325 ■ New Gas CT

Portfolio 2b: Includes Decrements 1-4

Resource Type 2020 2021 2022 2023 2024 2025 2026 2027 2028 2029 2030 2031 2032 2033 2034 2035 2036 2037 2038 2039 ■ New DSM 23 44 63 83 103 124 143 162 181 199 215 230 244 257 271 276 282 288 293 ■ New Wind 100 100 100 100 100 100 450 500 500 ■ New Solar 350 350 400 800 900 900 900 1,175 1,300 ■ New Battery Storage 40 60 60 60 340 380 380 380 380 ■ New Gas CC 325 325 325 325 325 325 ■ New Gas CT 100 100 100 100 100

Portfolio 2c: Includes Decrements 1-5

Resource Type 2020 2021 2022 2023 2024 2025 2026 2027 2028 2029 2030 2031 2032 2033 2034 2035 2036 2037 2038 2039 ■ New DSM 28 50 73 97 120 145 170 191 212 235 252 269 288 303 319 326 332 338 347 ■ New Wind 50 50 100 100 200 200 500 600 750 ■ New Solar 400 450 475 800 1,150 1,150 1,175 1,200 1,275 ■ New Battery Storage 20 320 360 360 420 420 ■ New Gas CC 325 325 325 325 325 325 ■ New Gas CT

Retirements in All Portfolio 1 Runs

Resource Type 2020 2021 2022 2023 2024 2025 2026 2027 2028 2029 2030 2031 2032 2033 2034 2035 2036 2037 2038 2039 Coal

  • 220
  • 220
  • 220
  • 220
  • 220
  • 220
  • 220
  • 220
  • 220
  • 220
  • 220
  • 220
  • 220
  • 220
  • 630
  • 630
  • 630
  • 630
  • 630

Gas

  • 200
  • 200
  • 200
  • 200
  • 620
  • 620
  • 620
  • 620
  • 620
  • 620

Oil

  • 40
  • 40
  • 40
  • 40
  • 40
  • 40
  • 40
  • 40
  • 40
  • 40
  • 40
  • 40
  • 40
  • 40
  • 40
  • 40
slide-84
SLIDE 84

PORTFOLIO 3 ICAP CHANGES

2019 IRP S takeholder Meeting 12.9.19 84

Portfolio 3a: Includes DSM Decrements 1-3 Resource Type 2020 2021 2022 2023 2024 2025 2026 2027 2028 2029 2030 2031 2032 2033 2034 2035 2036 2037 2038 2039 ■ DSM 18 33 49 64 80 97 114 128 143 157 171 183 194 205 215 216 219 220 223 ■ Wind 250 250 250 250 250 250 250 250 250 250 250 250 250 350 350 400 400 450 ■ Solar 375 425 475 550 575 650 700 700 700 725 725 725 725 725 825 1,125 1,250 ■ Battery Storage 40 80 80 80 100 100 100 120 340 360 380 500 520 560 560 560 560 ■ Gas CC 325 325 325 325 325 325 ■ Gas CT Portfolio 3b: Includes DSM Decrements 1-4 Resource Type 2020 2021 2022 2023 2024 2025 2026 2027 2028 2029 2030 2031 2032 2033 2034 2035 2036 2037 2038 2039 ■ DSM 23 44 63 83 103 124 143 162 181 199 215 230 244 257 271 276 282 288 293 ■ Wind 100 100 100 100 100 100 150 150 150 150 150 250 250 250 250 300 450 550 ■ Solar 450 600 650 725 750 750 800 850 925 1,000 1,050 1,050 1,075 1,075 1,175 1,350 1,450 ■ Battery Storage 20 40 40 40 240 240 240 360 380 420 420 440 440 ■ Gas CC 325 325 325 325 325 325 ■ Gas CT Portfolio 3c: Includes DSM Decrements 1-5 Resource Type 2020 2021 2022 2023 2024 2025 2026 2027 2028 2029 2030 2031 2032 2033 2034 2035 2036 2037 2038 2039 ■ DSM 28 50 73 97 120 145 170 191 212 235 252 269 288 303 319 326 332 338 347 ■ Wind 150 150 150 150 150 150 150 200 250 250 300 300 300 350 350 400 450 600 ■ Solar 400 525 575 575 575 625 650 675 725 725 775 825 825 875 975 1,250 1,325 ■ Battery Storage 20 20 20 40 60 60 60 60 260 280 280 380 400 420 420 420 420 ■ Gas CC 325 325 325 325 325 325 ■ Gas CT Retirements in All Portfolio 3 Runs: Resource Type 2020 2021 2022 2023 2024 2025 2026 2027 2028 2029 2030 2031 2032 2033 2034 2035 2036 2037 2038 2039 Coal (220) (220) (630) (630) (630) (630) (630) (630) (630) (630) (630) (630) (630) (630) (630) (630) (630) (630) (630) Natural Gas (200) (200) (200) (200) (620) (620) (620) (620) (620) (620) Oil (40) (40) (40) (40) (40) (40) (40) (40) (40) (40) (40) (40) (40) (40) (40) (40)

(630) (630) (630) (620) (620) (620) (40) (40) (40) 223 293 347 450 550 600 1,250 1,450 1,325 560 440 420 325 325 325 (2,000) (1,500) (1,000) (500) 500 1,000 1,500 2,000 2,500 3,000 3,500 Portfolio 3a Portfolio 3b Portfolio 3c

Installed Capacity (MW)

Cumulative ICAP Changes through 2039

Natural Gas Oil DSM Wind Solar Storage Gas CC Gas CT

slide-85
SLIDE 85

PORTFOLIO 4 ICAP CHANGES

2019 IRP S takeholder Meeting 12.9.19 85

(1,126) (1,126) (1,126) (620) (620) (620) (40) (40) (40) 223 293 347 1,350 1,250 950 1,475 1,500 1,500 940 780 560 325 325 325 100 300 (3,000) (2,000) (1,000) 1,000 2,000 3,000 4,000 5,000 Portfolio 4a Portfolio 4b Portfolio 4c

Installed Capacity (MW)

Cumulative ICAP Changes through 2039

Coal Natural Gas Oil DSM Wind Solar Storage Gas CC Gas CT

Portfolio 4a: Includes Decrements 1-3 Resource Type 2020 2021 2022 2023 2024 2025 2026 2027 2028 2029 2030 2031 2032 2033 2034 2035 2036 2037 2038 2039 ■ DSM 18 33 49 64 80 97 114 128 143 157 171 183 194 205 215 216 219 220 223 ■ Wind 500 500 500 500 550 600 600 600 700 800 850 900 950 950 950 1,150 1,150 1,350 ■ Solar 450 600 650 1,125 1,225 1,325 1,350 1,350 1,350 1,375 1,400 1,400 1,450 1,475 1,475 1,475 1,475 ■ Battery Storage 340 340 340 360 380 600 620 640 760 780 820 840 920 940 ■ Gas CC 325 325 325 325 325 325 ■ Gas CT Portfolio 4b: Includes Decrements 1-4 Resource Type 2020 2021 2022 2023 2024 2025 2026 2027 2028 2029 2030 2031 2032 2033 2034 2035 2036 2037 2038 2039 ■ DSM 23 44 63 83 103 124 143 162 181 199 215 230 244 257 271 276 282 288 293 ■ Wind 400 400 400 400 400 400 550 550 600 600 700 800 800 850 950 1,100 1,250 1,250 ■ Solar 425 550 600 1,100 1,200 1,250 1,325 1,325 1,350 1,350 1,350 1,350 1,375 1,425 1,425 1,450 1,500 ■ Battery Storage 240 240 240 240 260 480 500 520 640 660 680 700 760 780 ■ Gas CC 325 325 325 325 325 325 ■ Gas CT 100 100 100 100 100 100 100 100 100 100 100 100 100 100 Portfolio 4c: Includes Decrements 1-5 Resource Type 2020 2021 2022 2023 2024 2025 2026 2027 2028 2029 2030 2031 2032 2033 2034 2035 2036 2037 2038 2039 ■ DSM 28 50 73 97 120 145 170 191 212 235 252 269 288 303 319 326 332 338 347 ■ Wind 400 400 400 400 400 400 450 450 450 450 550 600 600 650 650 800 800 950 ■ Solar 400 400 400 900 925 925 975 1,025 1,475 1,475 1,475 1,475 1,500 1,500 1,500 1,500 1,500 ■ Battery Storage 20 80 80 200 220 240 240 240 320 340 360 380 400 440 460 540 560 ■ Gas CC 325 325 325 325 325 325 ■ Gas CT 200 200 200 200 200 200 200 200 300 300 300 300 300 300 Retirements in All Portfolio 3 Runs: Resource Type 2020 2021 2022 2023 2024 2025 2026 2027 2028 2029 2030 2031 2032 2033 2034 2035 2036 2037 2038 2039 Coal (220) (220) (630) (630) (630) (1,126) (1,126) (1,126) (1,126) (1,126) (1,126) (1,126) (1,126) (1,126) (1,126) (1,126) (1,126) (1,126) (1,126) Natural Gas (200) (200) (200) (200) (620) (620) (620) (620) (620) (620) Oil (40) (40) (40) (40) (40) (40) (40) (40) (40) (40) (40) (40) (40) (40) (40) (40)

slide-86
SLIDE 86

PORTFOLIO 5 ICAP CHANGES

2019 IRP S takeholder Meeting 12.9.19 86

Portfolio 5a: Includes Decrements 1-3 Resource Type 2020 2021 2022 2023 2024 2025 2026 2027 2028 2029 2030 2031 2032 2033 2034 2035 2036 2037 2038 2039 ■ DSM 18 33 49 64 80 97 114 128 143 157 171 183 194 205 215 216 219 220 223 ■ Wind 500 500 500 500 550 600 600 600 700 800 850 900 950 950 950 1,150 1,150 1,350 ■ Solar 450 600 650 1,125 1,225 1,325 1,350 1,350 1,350 1,375 1,400 1,400 1,450 1,475 1,475 1,475 1,475 ■ Battery Storage 340 340 340 360 380 600 620 640 760 780 820 840 920 940 ■ Gas CC 325 325 325 325 325 325 ■ Gas CT Portfolio 5b: Includes Decrements 1-4 Resource Type 2020 2021 2022 2023 2024 2025 2026 2027 2028 2029 2030 2031 2032 2033 2034 2035 2036 2037 2038 2039 ■ DSM 23 44 63 83 103 124 143 162 181 199 215 230 244 257 271 276 282 288 293 ■ Wind 350 350 350 350 350 350 400 450 450 450 450 550 550 600 600 800 1,000 1,100 ■ Solar 425 550 600 1,100 1,200 1,275 1,275 1,325 1,350 1,375 1,375 1,450 1,475 1,475 1,475 1,475 1,500 ■ Battery Storage 20 20 20 40 300 520 540 560 660 680 720 740 800 820 ■ Gas CC 325 325 325 325 325 325 325 325 650 650 650 650 650 650 ■ Gas CT 300 300 300 300 300 300 300 300 300 300 Portfolio 5c: Includes Decrements 1-5 Resource Type 2020 2021 2022 2023 2024 2025 2026 2027 2028 2029 2030 2031 2032 2033 2034 2035 2036 2037 2038 2039 ■ DSM 28 50 73 97 120 145 170 191 212 235 252 269 288 303 319 326 332 338 347 ■ Wind 500 500 500 500 500 550 550 750 950 1,150 1,150 1,200 1,200 1,300 1,300 1,300 1,500 1,500 ■ Solar 425 500 525 725 775 775 775 1,225 1,375 1,400 1,400 1,400 1,400 1,400 1,450 1,450 1,500 ■ Battery Storage 20 20 140 140 160 160 560 720 740 760 880 900 940 960 1,020 1,040 ■ Gas CC 325 325 325 325 325 325 325 325 650 650 650 650 650 650 ■ Gas CT Retirements in All Portfolio 3 Runs: Resource Type 2020 2021 2022 2023 2024 2025 2026 2027 2028 2029 2030 2031 2032 2033 2034 2035 2036 2037 2038 2039 Coal (220) (220) (630) (630) (630) (1,126) (1,126) (1,126) (1,126) (1,670) (1,670) (1,670) (1,670) (1,670) (1,670) (1,670) (1,670) (1,670) (1,670) Natural Gas (200) (200) (200) (200) (620) (620) (620) (620) (620) (620) Oil (40) (40) (40) (40) (40) (40) (40) (40) (40) (40) (40) (40) (40) (40) (40) (40)

(1,670) (1,670) (1,670) (620) (620) (620) (40) (40) (40) 223 293 347 1,350 1,100 1,500 1,475 1,500 1,500 940 820 1,040 325 650 650 300 (3,000) (2,000) (1,000) 1,000 2,000 3,000 4,000 5,000 6,000 Portfolio 5a Portfolio 5b Portfolio 5c

Installed Capacity (MW)

Cumulative ICAP Changes through 2039

Coal Natural Gas Oil DSM Wind Solar Storage Gas CC Gas CT

slide-87
SLIDE 87

NATURAL GAS PRICES

87

2009 - 2014 2015 - 2019 2020 - 2024 2025 - 2029 2030 - 2034 2035 - 2039 $0 $1 $2 $3 $4 $5 $6 $7 $8 $9 $10 $0 $1 $2 $3 $4 $5 $6 $7 $8 $9 $10

Real 2018$/MMBtu Real 2018$/MMBtu

P5-P95 Stochastic Range Historical Prices Carbon Case Reference Case Carbon + High Gas Carbon + Low Gas No Carbon + High Gas

Avg: $2.74 Avg: $3.82

Henry Hub Natural Gas Prices (2018$/MMBtu)

slide-88
SLIDE 88

POWER PRICES

88

2009 - 2014 2015 - 2019 2020 - 2024 2025 - 2029 2030 - 2034 2035 - 2039

$0 $10 $20 $30 $40 $50 $60 $70 $80 $90

$0 $10 $20 $30 $40 $50 $60 $70 $80 $90

Real 2018$/MWh

Real 2018$/MWh

Stochastic Range Historical Prices Carbon Case Reference Case Carbon + High Gas Carbon + Low Gas No Carbon + High Gas

Avg: $29.43 Avg: $33.38

MISO Indiana Hub 7x24 Power Prices (2018$/MWh)

slide-89
SLIDE 89

CARBON PRICE

89

$0.00 $5.00 $10.00 $15.00 $20.00 $25.00 $30.00 $35.00 $40.00 $45.00

Nominal $/metric ton

Federal Carbon Price in Scenarios A, B, C (Nominal $/ton)

slide-90
SLIDE 90

CAPACITY PRICES

90

$0 $50 $100 $150 $200 $250 $300 $350 $0 $50 $100 $150 $200 $250 $300 $350

Nominal $/MW-day

Floor: 5% of Fundamental/CONE Mode: 25% of Fundamental/CONE Ceiling: 60% of Fundamental/CONE Average of Floor, Mode, Ceiling

MISO Zone 6 Annual Capacity Prices (Nominal $/MW-day)

slide-91
SLIDE 91

LOAD FORECAST (ENERGY)

91

12,000,000 13,000,000 14,000,000 15,000,000 16,000,000 17,000,000 18,000,000

Annual Energy (MWh)

Full P5-P95 Spread Scenario C (Low) Scenario D (High) Base Forecast

IPL Annual System Energy Forecast before New DSM (MWh)

slide-92
SLIDE 92

LOAD FORECAST (PEAK)

92

1,500 2,000 2,500 3,000 3,500 4,000

Annual Peak (MW)

P5 - P95 Range Base Scenario C (Low) Scenario D (High)

IPL Annual System Peak Demand Forecast before New DSM (MW)