
http://www.cs.ubc.ca/~tmm/courses/journ16
Week 1: Intro, Tasks and Data, Marks and Channels
Tamara Munzner Department of Computer Science University of British Columbia
JRNL 520H, Special Topics in Contemporary Journalism: Data Visualization Week 1: 13 September 2016
Who’s who
- Instructor: Tamara Munzner
– UBC Computer Science
- Instructor: Caitlin Havlak
– Discourse Media
2
Class time
- 6 weeks, Sep 13 - Oct 18
–once/week, 3 hr session 9:30am-12:30pm
- standard week
–foundations lecture/discussion: 80 min –break: 15 min –demos: 45 min –lab: 30 min
- office hrs: 1-3pm most weeks
3
Structure
- participation, 10%
–attend lectures and demos, discuss
- tell us in advance if you’ll miss class (and why)
- tell when us recover if you were ill
- homework, 90%
–gradual transition from structured to open-ended –60%: 5 assignments
- best 4 out of 5 marks used, so15% each
- start in lab time, finish over the subsequent week
- due just before next class session (9am)
– some solo, some in groups of 2
–30%: final assignment
- find your own interesting data and design your own visualization for it
4
Further reading
- optional textbook for following up on visualization foundations lectures
–Tamara Munzner. Visualization Analysis and Design. CRC Press, 2014.
- http://www.cs.ubc.ca/~tmm/vadbook/
–library has multiple ebook copies –to buy yourself, see course page
- optional textbook for more about Tableau software
–Ben Jones, Communicating Data with Tableau. O’Reilly, 2014.
- http://dataremixed.com/books/cdwt/
- optional papers/books
–links and references posted on course page –if DL links, use library EZproxy from off campus
5
Finding us
- office hours in Sing Tao bldg
–1-3pm Tuesdays: Tamara and/or Caitlin –by appointment: Tamara in ICICS/CS bldg Room X661
- email other times
–tmm@cs.ubc.ca, caitlin@discoursemedia.org
- course page is font of all information
–don’t forget to refresh, frequent updates –http://www.cs.ubc.ca/~tmm/courses/journ16
6
Topics
- Week 1
– Intro – Tasks and Data – Marks and Channels
- Week 2
– Arrange Data Tables
- Week 3
– Color – Arrange Spatial Data
- Week 4
– Manipulate, Facet, Reduce
- Week 5
– Wrangle – Stories – Rules of Thumb
- Week 6
– Networks – Regression Lines – Vis in Newsrooms
7
Introduction: Defining visualization (vis)
8
Computer-based visualization systems provide visual representations of datasets designed to help people carry out tasks more effectively.
Why?... Why have a human in the loop?
- don’t need vis when fully automatic solution exists and is trusted
- many analysis problems ill-specified
– don’t know exactly what questions to ask in advance
- possibilities
– long-term use for end users (e.g. exploratory analysis of scientific data) – presentation of known results – stepping stone to better understanding of requirements before developing models – help developers of automatic solution refine/debug, determine parameters – help end users of automatic solutions verify, build trust
9
Computer-based visualization systems provide visual representations of datasets designed to help people carry out tasks more effectively. Visualization is suitable when there is a need to augment human capabilities rather than replace people with computational decision-making methods.
Why use an external representation?
- external representation: replace cognition with perception
10
Computer-based visualization systems provide visual representations of datasets designed to help people carry out tasks more effectively.
[Cerebral: Visualizing Multiple Experimental Conditions on a Graph with Biological Context. Barsky, Munzner, Gardy, and Kincaid. IEEE TVCG (Proc. InfoVis) 14(6):1253-1260, 2008.]
Why depend on vision?
- human visual system is high-bandwidth channel to brain
–overview possible due to background processing
- subjective experience of seeing everything simultaneously
- significant processing occurs in parallel and pre-attentively
- sound: lower bandwidth and different semantics
–overview not supported
- subjective experience of sequential stream
- touch/haptics: impoverished record/replay capacity
–only very low-bandwidth communication thus far
- taste, smell: no viable record/replay devices
11
Computer-based visualization systems provide visual representations of datasets designed to help people carry out tasks more effectively.
Why show the data in detail?
- summaries lose information
–confirm expected and find unexpected patterns –assess validity of statistical model
12
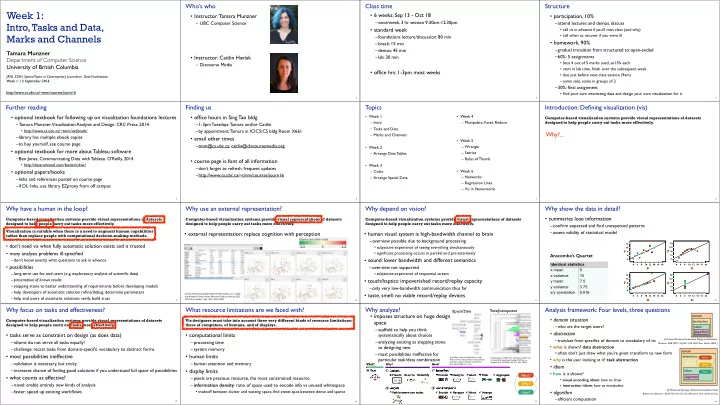
Identical statistics x mean 9 x variance 10 y mean 7.5 y variance 3.75 x/y correlation 0.816
Anscombe’s Quartet
Why focus on tasks and effectiveness?
- tasks serve as constraint on design (as does data)
–idioms do not serve all tasks equally! –challenge: recast tasks from domain-specific vocabulary to abstract forms
- most possibilities ineffective
–validation is necessary, but tricky –increases chance of finding good solutions if you understand full space of possibilities
- what counts as effective?
–novel: enable entirely new kinds of analysis –faster: speed up existing workflows
13
Computer-based visualization systems provide visual representations of datasets designed to help people carry out tasks more effectively.
What resource limitations are we faced with?
- computational limits
–processing time –system memory
- human limits
–human attention and memory
- display limits
–pixels are precious resource, the most constrained resource –information density: ratio of space used to encode info vs unused whitespace
- tradeoff between clutter and wasting space, find sweet spot between dense and sparse
14
Vis designers must take into account three very different kinds of resource limitations: those of computers, of humans, and of displays.
Why analyze?
- imposes structure on huge design
space
–scaffold to help you think systematically about choices –analyzing existing as stepping stone to designing new –most possibilities ineffective for particular task/data combination
15 [SpaceTree: Supporting Exploration in Large Node Link Tree, Design Evolution and Empirical
- Evaluation. Grosjean, Plaisant, and Bederson.
- Proc. InfoVis 2002, p 57–64.]
SpaceTree
[TreeJuxtaposer: Scalable Tree Comparison Using Focus +Context With Guaranteed
- Visibility. ACM
- Trans. on
Graphics (Proc. SIGGRAPH) 22:453– 462, 2003.]
TreeJuxtaposer
Present Locate Identify Path between two nodes Actions Targets SpaceTree TreeJuxtaposer Encode Navigate Select Filter Aggregate Tree Arrange Why? What? How? Encode Navigate Select
Analysis framework: Four levels, three questions
- domain situation
–who are the target users?
- abstraction
–translate from specifics of domain to vocabulary of vis
- what is shown? data abstraction
- often don’t just draw what you’re given: transform to new form
- why is the user looking at it? task abstraction
- idiom
- how is it shown?
- visual encoding idiom: how to draw
- interaction idiom: how to manipulate
- algorithm
–efficient computation
16
algorithm idiom abstraction domain
[A Nested Model of Visualization Design and Validation.
- Munzner. IEEE
TVCG 15(6):921-928, 2009 (Proc. InfoVis 2009). ]
algorithm idiom abstraction domain
[A Multi-Level Typology of Abstract Visualization Tasks Brehmer and Munzner. IEEE TVCG 19(12):2376-2385, 2013 (Proc. InfoVis 2013). ]