SLIDE 1
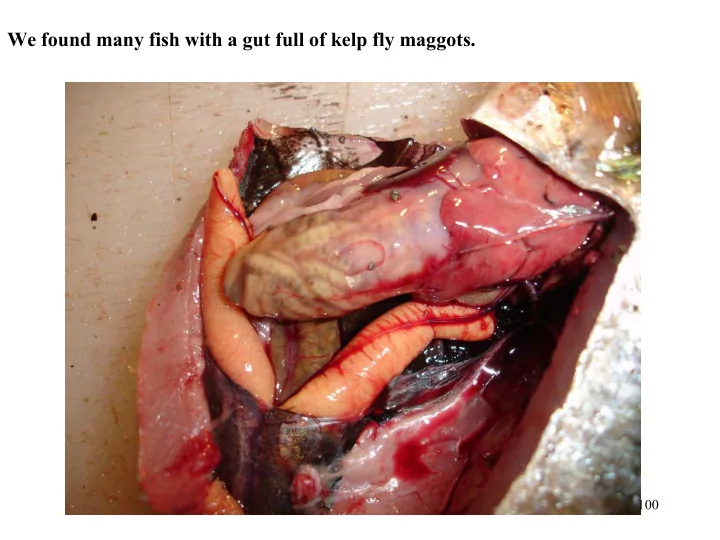
We found many fish with a gut full of kelp fly maggots.
100
SLIDE 2
Kelp fly maggots provide the protein for the yellow eyed mullet to ensure successful spawning.
101
SLIDE 3
Finding where the kelp flies lay their eggs took some research as no one knew until by luck we found them deep down under layers of beach cast seaweed. Note even kelp flies are not found in mud.
102
SLIDE 4
Sample of a number of kelp fly maggots carrying out a process that has never had any scientific study. The maggots are some how turning the cellulose in the beach cast seaweed into protein. The protein now within the maggots is then eaten by yellow eyed mullet who in turn are eaten by fish and dolphins that provides them with their protein requirements prior to spawning. Mud from the iron sands dredge waste will destroy the seaweed forests and stop beach cast seaweed from coming ashore.
103
SLIDE 5 Mud smothers seaweed and prevents fish from obtaining their traditional food
- sources. A past masters paper described how they lay their eggs by scrapping a
hollow in sand in bays that trapped warm water. They will not lay eggs in mud as the mud will bury the eggs fish are not that dumb.
104
SLIDE 6
In 1990 Wanganui experienced massive flooding. The commercial catch of blue cod from cod pots in MPI Area 8 Stat area 41 which is off both Patea and Wanganui dropped from an annual catch of 38 tonnes to 15 tonnes even though the fishing fleet had increased from 4 to 13 boats. Our clubs catch history showed a marked increase in blue cod caught from both the shore and boat fishers. We have found no fish can be caught off the shore when the waters run muddy. A sample of blue cod we caught 5.4.14 to show their gut content.
105
SLIDE 7
A closer look at a blue cod showing this fish had eaten a sea perch and no mud.
106
SLIDE 8
This cod had eaten krill and other marine life swimming by. But once again no mud can be seen.
107
SLIDE 9
This ones gut had a clear liquid and the remains of a fish. But no mud even when they have been feeding on small scallops that can be found in sand.
108
SLIDE 10
Female tarakihi with ripe roe. These fish are usually found with seaweed in their gut but never mud.
109
SLIDE 11
- The Joint Statement March 2014 section 15 fails to name a marine specie that
can live in mud day after day for twenty years. In our experience fish can not be caught from the shore when the waters become dirty with mud.
- In the experts Joint Statement they said there is “uncertainty as to how these
(unnamed specie) will react in sediment concentrations”.
- The importance and the message our presentation brings has been given
recognition by the experts as they have quoted they are “not aware of any reports that address these effects”. Yet the paper Dr J Grieve quotes in section 19 describes “that higher sediment concentrations result in lower intake of food particles and fewer eggs are laid”. While that directly applies to zooplankton NIWA have already produced a paper describing how fish eggs become buried in mud.
- Further in section 19 the experts have concluded that “there was likely to be no
effect on zooplankton other than what is already existing in the natural environment”. In section 20 “All the experts agree that direct effects of the increase of sediment concentrations on zooplankton are highly unlikely” which can only be described as unbelievable rubbish.
110
SLIDE 12
- The experts have just proven money talks and very naive of those who selected
them to expect people who are either employees of TTR or EPA to tell the truth and still think they would keep their jobs is asking too much.
- A detailed report from the North American Journal of Fisheries Management
titled “Effects of Suspended Sediments on Aquatic Ecosystems” has exposed the Joint experts corrupted statements. For example referring to zooplankton they described mud would cause a “reduced capacity to assimilate food”.
- For fish they describe “sediment acts directly on free living fish either by killing
them or by reducing their growth rate or resistance to disease” and that “sediment interferes with development of eggs and larvae” and that sediment “will modify natural movements and migration of fish”.
- These experts appointed by EPA and TTR have exposed their lack of marine
scientific knowledge and we seriously ask that the whole Joint Statement be considered misinformation. They have failed to predict that fish will be prevented from accessing their traditional spawning grounds causing fish to lose their genetic memory. MPI will be first to prove we are correct as when the mature fish are caught or die off they would have been prevented to guide the newly recruited fish back to food sources and spawning grounds.
111
SLIDE 13
- When the past Parliamentary Commissioner for the Environment John
Morgan Williams in his publication Missing Links described there was a problem through the resource consent process he only touched on a far bigger problem that we have personally experienced at all the ten resource consent applications we have been at or taken an interest in when he said:
- “What this report does not cover: As we examined the relationship between
science and environmental policy it became clear that it involved a broader range
- f issues than we could adequately address in a single report, for example:
- There are questions about whether science used in some adversarial approaches
to environmental policy and decision making contribute to sustainability. For example there is the potential for scientific evidence to be selectively used in resource consent hearings for the purpose of gaining or maintaining a particular interest or position, which could be to the detriment of the broader principles of sustainability.
- There are issues around the roles and influence of science and expert scientific
witnesses in legal proceedings on environmental issues (S1.3.1, p16).”
112
SLIDE 14
Protecting fragile marine intertidal ecosystems is non existent in the Wellington region.
113
SLIDE 15
Hutt River mouth has become a dredge waste dump site
114
SLIDE 16
- Since the Wellington Regional Council was formed we experienced first hand
the lack of marine knowledge in the council. We have seen research projects by pass taking notice of impacts. They have never evaluated the impact of dredge waste or chemicals on marine species and senior management have ignored our input and continued to destroy fragile marine ecosystems.
- The dredge waste being dumped into Wellington Harbour forms huge under
water balls of mud that can be seen rolling along Petone Beach just off shore making clouds of mud. Commercial fishers can not use flounder set nets there. In 1999 we tried to stop the WRC from dumping 1000 tonnes a year of dredge waste 800 metres off the Hutt River into marine chart identified submarine fresh water springs. The WRC called them natural holes and depressions in the harbour through the media.
- The marine life in the springs you will see as I took a couple of photos and the
fish life is impressive. When the WRC failed to read books in their own library
- r consult with marine recreational fishers the council produced a Wellington
Regional Coastal Plan they did not include the springs. As a result the HCC has placed the integrity of the Hutt Ground Water artesian water supply at risk by removing Point Howard Wharf piles known to enter the artesian gravels.
115
SLIDE 17
The mud is pushed into Wellington Harbour
116
SLIDE 18
The beginning of a major environmental disaster at Point Howard Wharf as Wellington is about to loose considerable back pressure in the Waiwhetu Aquifer. All because WRC would not include them in their coastal plan and NIWA failed to record them at this location on their bathometric chart. Now piles identified by science years ago as penetrating the aquifer are being removed by the HCC.
117
SLIDE 19
Current management of Wellington Harbour allows the destruction of marine ecosystems.
118
SLIDE 20
As the tide comes in the mud breaks away and washes into the sea. It is all very well for NIWA to compare the impact of mud at Wanganui with Wellington Harbour telling us the harbour is filling up at the rate of 2 centimetres a year. But NIWA said nothing to stop the Wellington Harbour submarine freshwater springs being filled and only the WRMFA opposed it at the resource consent hearing.
119
SLIDE 21
While algae provides a major food source for fish they will not enter water this heavy in mud.
120
SLIDE 22
By Comparison here is the clean clear waters of Ohau Bay on the south western coast taken the same day
121
SLIDE 23
Comparing the Hutt River mouth with the rock pools at Makara. Full of life.
122
SLIDE 24
Another look at the rook pools at Makara.
123
SLIDE 25
After the sand is extracted the mud is held in a pit prior to being dumped into the Wellington harbour.
124
SLIDE 26
125
SLIDE 27
Disposing of dredge waste the Wellington Regional Council way. This is on land and only a small amount. But take 50 million tonnes a year that is the entre coal production for more than 110 years from the Stockton Plateau mine. Or three months of the total coal exports from Queensland that produces 196 million tonnes a year at a time when commodity prices are plunging.
126
SLIDE 28
A resource consent was granted knowing the mud gets washed into the sea in a southerly.
127
SLIDE 29
Dredge waste waiting to be washed into Wellington Harbour.
128
SLIDE 30
A resource consent was granted knowing the mud gets washed into the sea in a southerly.
129
SLIDE 31
130
SLIDE 32
The mud rolls through the near shore shellfish beds smothering and killing the shell fish. They was ashore days later.
131
SLIDE 33
Some times the impact of the mud is terrible along Petone Beach.
132
SLIDE 34
When I was on the Wellington Port Company dredging committee we worked out a way to reduce the impact on marine life. We did not want a repeat of the Auckland dredging waste disaster where both dump sites off Manukau and Waitemata Harbours are completely dead with marine life yet to return. This proposal to dump dredge waste six metre above the sea bed would never have received a resource consent in Wellington.
133
SLIDE 35 Before the WRC had a chance to fill in the submarine fresh water springs I ran my boat
- ver them to record what they
looked like on my sounder and take some photos. It is not guess work to locate these springs but finding the mysid shrimps blooming was a result of the timing required to see the springs working The springs are the reason why Wellington harbour has 56 different specie over 500
- grams. The photo is recorded
in the NZ National Library.
134
SLIDE 36
Mud and silt now smothers everything in this Wellington Harbour submarine fresh water spring.
135
SLIDE 37
The submarine fresh water springs of Wellington Harbour once bulged the surface with drinkable fresh water. A marine chart may display a sea bed as flat but it will also displayed hills, hollows and reefs. The hollow can be caused by fresh water rising or by the current passing over a rock. Rising fresh water can be hard to find if you don’t know when to look and in low flows a string of bubbles may be all that can be seen. Victoria University never found one spring in all their trawl surveys of the harbour. They helped WRC select the dredge waste dump site and believed they had found a natural hollow until I told them it was a spring and I had caught 30 snapper off them twice.
136
SLIDE 38 It is hardly surprising that NIWA and Dr Alan Orpin did not know of the springs
- ff Patea and Wanganui as NIWA did not have the marine knowledge to make an
accurate bathometric chart of Wellington Harbour. LINZ, DOC and WRC have ignored our concerns and information since 1999 as they keep trying to keep them a secret. LINZ will not include them on marine charts, WRC refuse to include them in the Wellington Regional Coastal Plan, DOC refuses to recognise them as areas of significant conservation value and NIWA will not identify the mysid
- shrimps. The NIWA Wellington Harbour bathometric chart information looks
like guess work as many springs are missing and the springs displayed on LINZ marine charts are not recorded.
137
SLIDE 39
The beginning of a major environmental disaster at Point Howard Wharf as Wellington is about to loose considerable back pressure in the Waiwhetu Aquifer. All because WRC would not include them in their coastal plan and NIWA failed to record them at this location on their bathometric chart. Now piles identified by science years ago as penetrating the aquifer are being removed by the HCC.
138
SLIDE 40
The error ridden NIWA bathometric chart. Even the massive spring under the Seaview Wharf that was caused during construction is not shown. The springs in Evans Bay, Falcon Shoals, Point Howard Wharf, off Aotea Quay Wharf, off the wharf at Somes Island, off Petone Wharf at the break water wall at the Seaview Marine are not shown.
139
SLIDE 41 By not locating major submarine fresh water springs NIWA have demonstrated they lack research and marine knowledge on how to locate the springs. Information could have been found in the Book Rugged Landscape by Graeme Stevens and in a thesis by Steven Harding for a Masters of Science Honours degree or the story I wrote for the NZ Fishing Coast to Coast magazine titled The springs
- f life.. Dead and buried?
140
SLIDE 42
While the springs appear to be located on this chart all underwater features are at least 150 metres way from the location on the chart. The reason for this is all marine charts were made from a survey in 1956 before GPS then transposed onto electronic charts using the Wooden Goodem 49 system. After a while they discovered the world was oval and a new system called WGS 84 was introduced.
141
SLIDE 43
Off the Patea river mouth there will be many submarine fresh water springs judging by the many holes in the sea bed displayed on charts and the massive schools of mackerel that arrive at night to eat the mysid shrimps. There is another indicator as the geology in the hills behind Patea is a raised sea bed covered in sand stone and shells with many tunnels in the area and some would go into the sea. I discovered this when I was repairing motor scrapers at the Dam as at times all work stopped as they had found previously unknown water tunnels through the hills.
142
SLIDE 44
Wanganui to Patea submarine fresh water springs. While I can see where the springs should be it takes a number of other conditions to occur before some one could find them as these LINZ marine charts are at least 150 metres out. The springs provide the food for shrimps in turn mackerel then fish and marine mammals.
143
SLIDE 45
- When Rosemarie Thomas was a regional councillor she was informed that the
WRC council scientists and those at Victoria University and NIWA could not find a reason as to why there was no longer native fish or eels in the Pencarrow and Fitzroy Lakes.
- She asked if I could visit the lakes to see if I could find the cause. Accepting
the challenge I visited the lakes with our clubs most experienced shore fisher. When he described they could no longer catch moki in front of the shingle piles I realised the problem. The shingle piles were in fact dredge waste dump sites with sand removed. Without sand the shingle could no longer retain water and the sand hoppers the food that moki eat could no longer live there. Without sand at the lake outlets the lakes water could no longer reach the sea.
- Photos taken in February 1946 clearly show both the lakes water reaching the
- sea. The errors made by the WRC in granting the resource consent to mine in
front of the lakes and also allow mining into the sea was the main reason. The loss of access to the sea for the lake waters also destroyed the major spawning area for the regions yellow eyed mullet schools and after five years they disappeared as well. Although advised and shown photos how to repair the damaged lake outlets senior WRC management have been reluctant to accept
- ur marine knowledge and the experience of other councils.
144
SLIDE 46
Fitzroy Lake has never had an outlet to the sea since the WRC allowed sand mining at the lakes outlet.
145
SLIDE 47
The Wellington Regional Council designed a new lake outlet. The outlet is to the same standard as the Wellington Coastal Plan and that also blocks off fresh water.
146
SLIDE 48
For WRC to intentionally construct a lake outlet without sand is environmental vandalism but their scientists as well as NIWA and Victoria University scientists could not see the fault. This an example of NZ marine scientific knowledge. No wonder NIWA scientists can not see what is wrong with the sand mining application.
147
SLIDE 49
148
SLIDE 50
As a result of sand mining the water from the Fitzroy Lake rarely reaches the sea. The WRC has created a soak hole. Before mining the lakes water reached the sea even in a drought. This error by WRC caused a major marine fish spawning area to be lost forever. Sand mining changes the marine environment for ever.
149
SLIDE 51
Pencarrow Lake outlet. For years HCC, WRC, DOC, NIWA, Victoria University and Iwi would drive past and see the eels and native fish dying in this pool. But due to their combined lack of marine knowledge they did not see the problem and as result never produced a cure.
150
SLIDE 52
Out from the small pool some times the water made a bigger pool. However still the waters from this lake never reach the sea. All due to sand mining resource consent errors by WRC. Although advised how to correct the error they have failed to implement the cure.
151
SLIDE 53
Sand is not a renewable resource and the drive for more high quality sand will cause major problems for future generations. Sand mining in process Fitzroy Bay Wellington 7.04
152
SLIDE 54
153
SLIDE 55 In the photo there could be 50 piles of dredge waste each of about 50 tonnes making a total of 2500 tonnes. Now imagine that pile 20,000 times higher as you would be dreaming to believe a trench could be dug eleven metres into the sea bed and stay upright to take the 45 million tonnes of waste. All the waste will do is sit
- n top of a slight depression as the machine advances. Every hour at the rate of
8000 tonnes an hour the pile is 3 times higher until at the end of the year the pile is 18,000 times higher than what you can see in this photo. This is mining on a massive scale.
154
SLIDE 56
Sand mining produces considerable waste. The process is not renewable and once the sand is extracted the waste can not retain water and without water there is no life.
155
SLIDE 57
156
SLIDE 58
Sand mining Wainuiomata Beach in the 1980s
157
SLIDE 59
Wainuiomata Beach after years of sand mining. Sand mining is not a renewable resource
158
SLIDE 60
While some can find a use for mining waste in a fish tank its value is limited. Note there is no sand on this beach.
159
SLIDE 61
A beach without sand has no life
160
SLIDE 62
For years we knew the fast ferries were sucking up the pilchard and yellow eyed mullet schools and washing the seaweed off the beaches with their 48 two metre tidal waves a day. The blue cod also lost their seaweed as it became smothered in mud and as seaweed grows through photosynthesis the weed quickly died. Marine science has demonstrated in the Joint Statement we have senior marine scientists who still have not a clue about the life under water.
161
SLIDE 63 It was not until I drove my boat into the wake of the fast ferry and took this photo
- ff my depth sounder showing the under water wave blasting the sea bed at 42
metres that the full impact could be judged as the Sounds are less than 35 metres. Three months after I sent this photo to Sandra Lee the ferries were taken out of service.
162
SLIDE 64
Makara Stream. It is very naive for anyone to think that behind the dredge there will be walls standing 11 metres high when we have gravity acting on both the land and underwater. The exposed mud now a slurry will be in a uncontrollable state and will flow around the machine and up into the water column. The mud flowing up to the surface will be massive and uncontrollable as the method has lacked any common sense from scientists from the beginning.
163
SLIDE 65
- Power and communication cables are laid with a plough all around the World.
In the north sea they made massive ploughs to lay the oil pipe lines.
- It is unbelievable that those at TTR think their under water wall of sand will
remain up right so that they can fill in the trench. In reality there will be no trench remaining just a slight hollow in the sea bed. Just as if you dug a trench
- n the beach the sea will bring sand and it will be filled in. If not all sand
castles the children made will be still there the next day.
- The next question by removing 50 million tonnes a year where will the sand
come from for nature to fill in the trench as the discharge waste product will arrive too late and will only lie on top of the sand nature provided.
- As the most active zone is the beaches the sand will have to come from the
coastal beaches. But the beaches are already being exposed to bigger tidal surges and bigger storm surfs. Who will provide the money and skills to protect the beaches when already councils are not allowing buildings near the coast or barriers to properties properties.
164
SLIDE 66
Makara Stream banks can not remain upright near the stream. Off the Patea under water the result will be far worse as the sand would have been liquefied by the process. It is misinformation by scientists to say there will be a trench with walls at the extraction site. Once the product is extracted the site will rapidly become a slight hollow in the sea bed just as hole on a beach becomes.
165
SLIDE 67 Underwater the result will look like this or even worse as mud and silt coming out
- f a pipe at 133 tonnes a second six metres or more above the sea bed will cover
rocks and make it impossible for new growth to attach. Even if they did attach they could not grow as they obtain their food source from the sun and the mud will turn the marine environment into night.
166
SLIDE 68
It is obvious the result will be instantaneous as all marine life would have lost their food source and spawning grounds. Then after five to seven year the fish will loose their genetic memory and die off never to return to the coast again. Just as they have done in Porirua Harbour and Fitzroy Lake. Marine specie do not dig in mud looking for algae food.
167
SLIDE 69
In Wellington Paua only grow to this size because we have clean water. New Plymouth and Pukerua Bay have dirt water and they call the paua stunted. When Mt Ruapehu erupted the pumis came down the Wanganui River and arrived at the Makara Beach three days later. Mud and silt will smother the paua at D’Urville Island and as science describes this area as the major spawning area for all paua the paua industry will almost collapse over night as the paua will have no food.
168
SLIDE 70 Glasswort beds in the Makara Estuary can also be found around our coastal shore
- line. As the tide comes in they provide marine specie with food source. Mud will
smother these plants.
169
SLIDE 71
To give an indication of how fragile these plants are this photo is showing the fruit, leaves and flowers that yellow eyed mullet graze on. Mud destroys this food source.
170
SLIDE 72
There is an obvious error proposed by TTR as they proposes to take water samples 15 cm below the sea surface. This will produce corrupted information as freshwater floats as a thin layer on the open sea. The method should be all samples must be taken 0 to 15 cm from the surface. Take for example the HCC waste water spreading a slim layer over Fitzroy Bay before coming into Wellington Harbour with the incoming tide and with a south easterly into Seatoun Beaches.
171
SLIDE 73 The slick of waste water chemicals rising from the broken WCC outfall in Lyall
- Bay. The dredge waste product being discharged on the sea bed will be “brine”
which is mix of sea and fresh water however it will also contain flocking chemicals. This product will be lighter than seawater and as such will come straight back up to the surface. Every flocking chemical poisons marine life. Iron sands contain carbon a product that Woods Hole Institute spread over the sea causing a massive algae bloom. The iron sands waste now on the surface with carbon that will cause a massive algae bloom for years however this bloom will contain chemicals making the algae bloom poisonous. Fish eat algae and overseas they found marine mammals that died from eating poisonous fish. Beaching of marine mammals will be almost a daily event.
172
SLIDE 74 Fresh water travels can travel on the sea surface for fifty miles or more in light
- winds. The effect of WCC waste water travelling along the coast is put on display
every time it rains and a south-easterly wind arrives. The effect is just like blowing on a saucer of water the wind pushes the waste water into all the rock pools along the coast until the public gets a whiff and the beaches to Owhiro Bay are closed although the product travels a lot further than that. The Cawthron marine scientist told the WCC resource consent that 4000 litres a second would mix with sea water inside 200 metres. We exposed his misinformation to the NZ Environment Court with overseas publications proving scientists use their position to destroy the environment.
173
SLIDE 75
Chemicals from the WCC waste water plant wash ashore killing all intertidal life along the Wellington South coast. It only takes one pass and the rocks have been chemically washed and just like washing your house the algae fails to grow again. Algae is major marine food source. The chemical coming from the plant will have an impact on marine life as the ribbon of chemical enriched surface water weaves around the site pushed by the wind. Scientists tell me it will take five to seven years before algae will grow again mean while all shellfish along the shore line will disappear.
174
SLIDE 76
With these photos of WRC mud management Iwi used them to demand the Porirua City Council take ownership of the harbour. No fish can be caught in this harbour now. The following photos show what I found when I tracked the source. Porirua 08.
175
SLIDE 77
176
SLIDE 78
177
SLIDE 79
Mud then came along the coast smothering the intertidal marine ecosystems on the rocks of the Aotea Lagoon next to Okowai Lagoon. All marine life dies under these conditions.
178
SLIDE 80
179
SLIDE 81
Lagoons and Porirua Harbour being filled with mud from Aotea subdivision. Harbour lost a metre of depth in ten years and fish no longer can be caught there. All due to mismanagement of sediment by Wellington Regional Council
180
SLIDE 82
The result of excessive run off. The Porirua ramp keeps going down as it was a metre deeper at low tide, ten years ago. The harbour also had shell fish but not now as being buried in mud kills everything. Ten years ago Waka crews once swam across the harbour here now they can walk across.
181
SLIDE 83
Surface currents don’t go in computer manufactured rhythms. They are generated by changing air pressure systems. I have been the first in NZ to record that high air pressures lowers sea levels. A week later a deep low developed off the Chatham Islands raising sea levels that produced through the Cook Strait a current so strong it ripped out the salmon farm in the Sounds.
182
SLIDE 84 Ohau Point with the sun above it. The current can run to the south for twenty four hours or more. The returning surface water produces a current that has to be seen to be believed as at Ohau Point the pressure waves caused by the returning water can be over three metres. At Terawhiti Point this fast current hits the surface waters from another system producing peaking and collapsing waves. One
- f the fast ferries found they had entered pressure waves over sixteen metres high
and as they collapsed the ferry free fell and stove in its side by over a metre.
183
SLIDE 85
Meridian accepted my marine knowledge for the West Wind turbine farm. Instead of break waters and causeways they built a wharf where I suggested and when they had finished pulled it out as I suggested. There was no environmental damage and all turbine parts were safely unloaded.
184
SLIDE 86
- How fast this returning current can be described as three days after the
Wanganui floods we had mud off Makara and three days after a volcanic eruption we had pumice at Makara.
- There can be no doubt that Wellington will be also smothered in mud from the
iron sands extraction. But so will D’Urville Island and Admiralty Bay the site
- f massive mussel farm. The Marlborough Sounds will once again return to a
mud hole and the blue cod will move out again.
- For commercial the impact of the mud travelling with the fast north to south
current will be massive. For example paua will no longer have access to the new seaweed and they will die out. The spat from crayfish spawning at D’Urville Island that collects in the big back eddy off the Wairarapa Coast before travelling onto that coast and drifting in the sub Antarctic flow up to Gisborne will no longer be there.
- It is little wonder Hadfield could not give an answer to the question “how far
will the mud travel” as his computer model is just that a model. Just as a computer game of fishing is as you caught nothing and you learnt nothing while
- thers were in the real world catching real fish and learning about the real
environment.
185
SLIDE 87
The Makara coast line with Mana and Kapiti Islands in the distance. The mud slick from any iron sands mining will arrive days after the operation begins. In the distance is Pukerua Bay where we called a public meeting to sell the idea of a closed fishing area for line fishing only. It was an attempt to improve paua stocks in the bay. It has not been successful as while paua spat arrives the food source of the paua keeps getting smothered in mud from the rivers north of the bay.
186
SLIDE 88
When the F69 was being proposed to be sunk off Island Bay such was NIWA’s knowledge of the Cook Strait currents they said nothing. Marine charts for Wellington depict sea bed currents of .9 knots at its fastest which has nothing to do with surface currents. Knowing the currents at the site it was easy to predict that this boat would quickly break up and wrote a story in the NZ Fishing C2C about its future and no one believed me. When it broke up weeks after it was sunk TV3 news asked how I knew and what will happen now.
187
SLIDE 89 Low pressure systems and on shore winds raise sea levels resulting in extremely fast currents through the Cook Strait. Attending ten resource consent hearings I have yet to find a marine scientist who has a basic understanding of the marine
- environment. I have now had WRC scientists argue that fresh water does not
float on sea water and another thinks Porirua Harbour main cause of pollution is from boy racers and cigarette buts.
188
SLIDE 90 Huge seas such as this create massive surface and sea bed currents not just in Wellington but all around the country. The NIWA description of the currents off Patea are a joke as any surfer or recreational fisher will tell you. These scientists should have researched history and learnt from the 1962 huge southerly swell that came with no wind and picked up the 40 tonne rocks protecting the new airport
- runway. The so called 0.2 knot currents that LINZ tell you that are in Lyall Bay
rolled them along the coast into the outer bay of the Taputeranga Island at Island Bay.
189
SLIDE 91
Low pressure systems when combined with other factors can raise sea levels over two meters and cause a lot of damage. Science in NZ has never predicted a sea surge event but NIWA scientists are quick to warn the public to watch out for the next high tide and in doing so confirming they have little marine knowledge.
190
SLIDE 92
The currents generated by sea water surges will be surface currents which have nothing to do with the NIWA computer models as they have been made from the misinformation on LINZ marine charts which depict sea bed currents as surface currents.
191
SLIDE 93
NIWA could not forecast the over two metre tidal surge that combined with strong winds that flooded the Seaview industrial area in seawater causing millions of dollars damage. Tidal surges are not that hard to predict but NIWA has not developed the resources to predict them and even less when they tell the public to wait for the next high tide.
192
SLIDE 94
This is an example of the changing weather patterns that also washed out the rail tracks in Wellington Harbour. Not once has the NIWA current model for Wanganui described surface currents.
193
SLIDE 95
Red gurnard spawn in shallow waters close to shore such as Lyall Bay then their eggs rise to the surface to be pushed by the wind into the inshore shallows. Blue cod also spawn in the shallows and their eggs get pushed by the wind into the shallows where they hatch. But their eggs will be unable to hatch as they will be buried in mud. There is a secret world under the sea that few understand but many destroy.
194
SLIDE 96
- We live in a “society that in many areas really does not know what it
does not know”. So said Dr J Morgan Williams the past Parliamentary Commissioner for the Environment in 2004 in his foreword to another excellent document called See Change.
- He also went on to say “we need a much deeper understanding of
the demands and pressures of our current society on the health and long term sustainability of our natural resources”.
- In 1999 he produced a document called Setting course for a
sustainable future: the management of New Zealand’s marine environment in which he had this to say “New Zealand’s lack of marine knowledge is a serious environmental and economic risk”.
195
SLIDE 97
- In December 1999 the Parliamentary Commissioner for the Environment
(PCE) Dr J Morgan Williams published a document called Setting Course for a Sustainable Future. The Management of New Zealand's Marine Environment.
- In section 5, page 74, Adequacy of Environmental Information (5.2) "Different
kinds of information" he had this to say: --
- However, in an information scarce environment like the marine environment,
informal information will often be a resource that marine managers cannot afford to neglect or ignore.
- At an Oceans Policy meeting I was asked how can we use your marine
- knowledge. My reply was I do not know what you don’t know until you say or
do something then I know you don’t know. This resource consent has exposed there is serious lack of marine scientific knowledge in NZ.
- There were no computer generated models in our presentation just photos
showing that our marine fish do not eat mud. The muddy brine will travel great distances on the sea surface impacting on the mussel industry in the Sounds and game fishing industry to the north. The muddy brine at 2,222 litres a second will prevent native fresh water fish from seeking out clean sea water in which to live. Maui dolphins will no longer be able to feed in their traditional waters
- In an age where every one is accountable the impact on the marine
environment and other industries will be so great it will be unacceptable.
196