
SLIDE 1
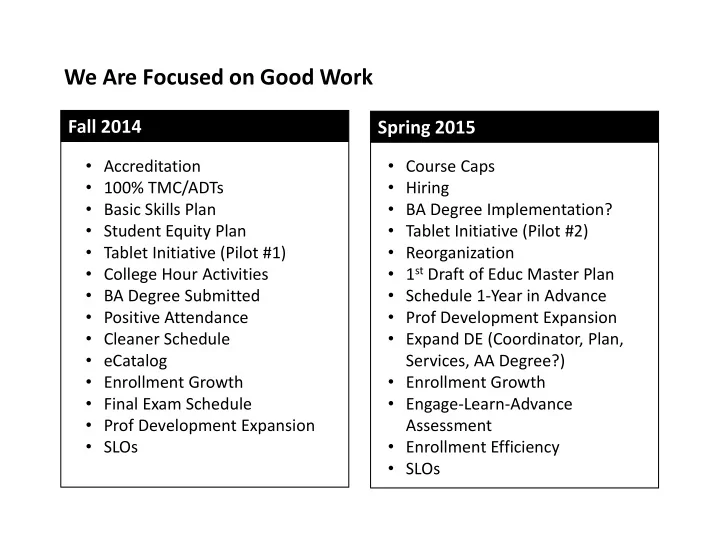
Fall 2014 Spring 2015
- Accreditation
- 100% TMC/ADTs
- Basic Skills Plan
- Student Equity Plan
- Tablet Initiative (Pilot #1)
- College Hour Activities
- BA Degree Submitted
- Positive Attendance
- Cleaner Schedule
- eCatalog
- Enrollment Growth
- Final Exam Schedule
- Prof Development Expansion
- SLOs
- Course Caps
- Hiring
- BA Degree Implementation?
- Tablet Initiative (Pilot #2)
- Reorganization
- 1st Draft of Educ Master Plan
- Schedule 1-Year in Advance
- Prof Development Expansion
- Expand DE (Coordinator, Plan,
Services, AA Degree?)
- Enrollment Growth
- Engage-Learn-Advance
Assessment
- Enrollment Efficiency
- SLOs