waukesha co county
play

Waukesha Co County Introductions Recycling Program Rec ecyclin - PDF document

12/15/2016 Presentatio ion Outlin ine Waukesha Co County Introductions Recycling Program Rec ecyclin ing g & & Sol olid Waste Household Hazardous Waste Yard and Wood Waste Composting 2016 Community Meeting


  1. 12/15/2016 Presentatio ion Outlin ine Waukesha Co County • Introductions • Recycling Program Rec ecyclin ing g & & Sol olid Waste • Household Hazardous Waste • Yard and Wood Waste Composting 2016 Community Meeting • Electronics and Appliance Recycling Com Communitie ies Partic icip ipatin ing in Waukesha Cou County Join oint MRF RF Operatio ions Recyclin ling & Stor Stormwater Edu Education Progr ograms Lege gend (33 total communities) s) Processing: • 300 tons/day Recycling & Stormwater (20) • 35 tons/hour (avg.) Stormwater only (6) • 65,849 tons (Jan-Nov.) Recycling only (7) 53 Intergovernmental al Agreements! Receives/Ships • 65 inbound trucks per day • 11 outbound trailer/day 
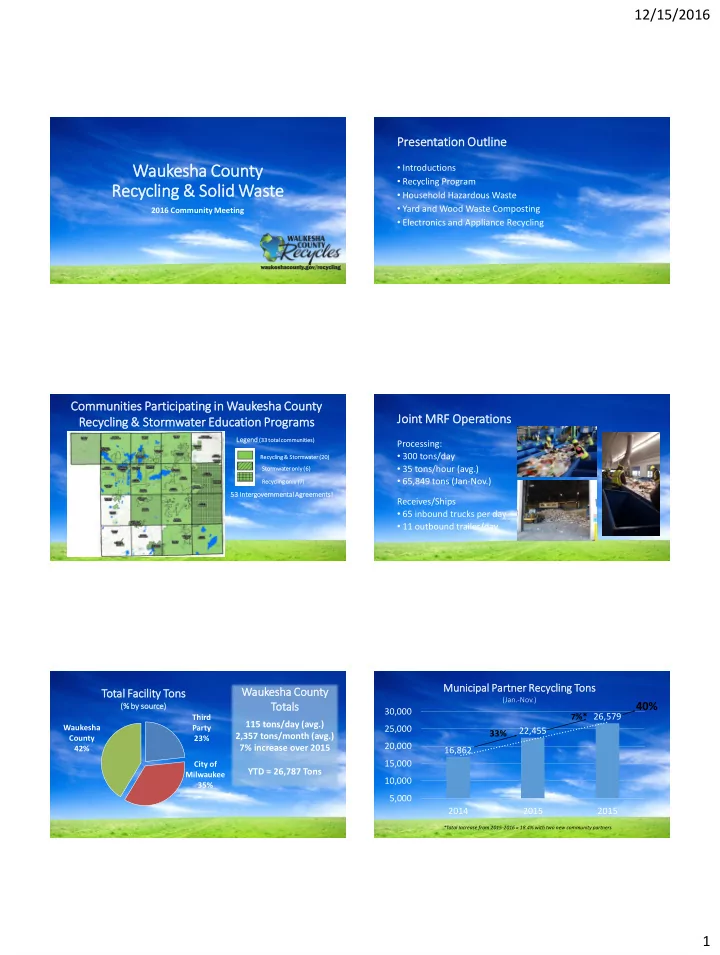
Muni unici cipal Part rtner er Recy cycling g Tons ns Wau aukesha Cou ounty Tot otal al Fac acility Ton ons (Jan.-Nov.) Tot otal als 40% (% % by source) 30,000 7 %* 26,579 Third 115 tons/day (avg.) Waukesha Party 25,000 22,455 33% 2,357 tons/month (avg.) County 23% 20,000 7% increase over 2015 42% 16,862 15,000 City of YTD = 26,787 Tons Milwaukee 10,000 35% 5,000 2014 2015 2015 *Total Increase from 2015-2016 = 18.4% with two new community partners 1

  2. 12/15/2016 Rec ecyclable Mar arkets Rec ecyclables Rec ecyclables Sa Sales 199 991-2016 2016 Pr Proc ocessed & & Sh Shipped Rev evenue (% % by weight) (% % of to tota tal l sal ales/ship ipped) $180 Mixed $160 Plastics, Average Commodity Revenue Mixed 2.24% $140 Plastics, 2001-2016 = $106 per ton Dollars Per Ton Paper & Cardboard, 0.84% $120 Steel/Tin, Glass, 52.04% 3.82% 21.54% Glass, $100 0.13% Paper & $80 PET Plastic $90.03 Cardboard Steel/Tin, $60 (#1), HDPE , 63.25% 4.48% 2.74% Plastic $40 Aluminum, (#2), PET Aluminum $20 17.02% 15.36% Plastic , 1.38% (#1), HDPE Plastic $0 10.14% (#2), 5.03% Paper & Cardboard = 52.04% of revenue Paper & Cardboard = 63.25% of tonnage Plastic & Aluminum = 43.36% of revenue Plastic & Aluminum = 11.4% of tonnage Recyclin ling Progr ogram - Con Contamin ination Cont. Contamination Issues Impacts • Propane Tanks • Increased disposal costs • Average 60 per day (high = 140) • Damage to equipment • Plastic bags/film • Increased repair costs • Steel/Metal (brake rotors, etc.) • Operating downtime • Increased operating costs • Other • Safety hazards to MRF workers • furniture, appliances, electronics, animal parts, carpet, rocks, hoses, tires Recyclin ling Progr ogram - Ba Battlin ing Con Contamin inatio ion Recyclin ling Progr ogram - Ba Battlin ing Con Contamin inatio ion • Propane Tank Recycling Cooperative We Appreciate Your Help! • Recycle Right Campaign • Continue to enforce collection • Mobile Application contracts waste screening protocol • Outreach & Education • Providing recycling education • Social Media • Liking and sharing social media posts • Press Release • Keep promoting the mobile app • Press Conference • Annual Newsletter 2

  3. 12/15/2016 Haule ler Comp Complia iance Recyclin ling Progr ogram – 2017 Divid idend Bu Budget • Five (5) complaints • Specific to ADS and UTD service Base Dividend = $600,000 2017 • All complaints = drivers commingling recyclables with refuse Recycling Incentive = $570,000 Maximum • Violation of state law, county ordinance, community contracts Distribution: • Evidence Total Base + Incentive = $1,170,000 $1,750,000 • https://www.youtube.com/watch?edit=vd&v=-hw1xK9X7Mw • https://www.youtube.com/watch?v=64PZipmVg-4 Direct Haul = $201,000 • County Enforcement Action Recycling Containers = $379,000 • Formal NOV & citation to be issued • Required submission of Corrective Action Plan Total Hauling + Containers = $580,000 • Municipal Enforcement Action Rec ecyclable Sa Sales Vs. Com ommunity Di Dividends State Gr Sta Grant Funding vs vs. . Divid idend Paym yments Wau aukesha Cou ounty MRF RF 200 001-2017 $2,000,000 $180 Recyclable Sales Per Ton ($) $2,000,000 Community Dividends ($) $1,750,000 $160 $1,800,000 $1,500,000 $1,600,000 $140 $1,400,000 $120 $1,250,000 $1,200,000 $100 $1,000,000 $1,000,000 Estimated $80 $800,000 $750,000 $60 $600,000 ESTIMATED $40 $400,000 $500,000 $20 $200,000 $250,000 $0 $0 2008 2009 2010 2011 2012 2013 2014 2015 2016* 2017 State Grant Funding County Recycling Dividend Recyclable Sales Per Ton ($) Community Dividends ($) Education & Outreach Edu Education & Outreach Edu • Over 7,000 residents attended a • Retzer Nature Center Remodel recycling event or program including: • MRF tours for 700 residents • Incorporate classroom and exhibit space • 102 school programs/assemblies for recycling/water education • Presentations/Workshops for 58 • Space remodel in progress community groups • Completed Spring 2017 • Presentation/Workshops at 28 • Final exhibit space concepts completed community events • Fabrication & Installation • Outreach: • Completed Fall 2017 • 35 outreach events (staffed/unstaffed) • Estimated reach ~6628 (staffed) 3

  4. 12/15/2016 Future Changes Coming… A Few Reminders… • Re-TRAC • Contact RSW staff: • Required upgrade to new platform (Re-TRAC Connect) • Changes in drop-off site operations • Reporting structure/format similar/improved • Assistance with parks/event recycling • Increased costs for annual subscription • Assistance with promotional/education materials • Historical data not included/uploaded to new platform • Opportunities for staffed/unstaffed outreach • County can provide to partners as requested Hou ousehold Hazardous Waste Hou ousehold Hazardous Waste • Implemented changes in 2015 reduced costs $20,000 • 2016 Statistics (January-October) • 2016 program costs projected to exceed approved budget • Participation = 4,748 1% • Additional 30,000 pounds of materials (estimated) • Pounds Collected = 206,711 • Participation rates relatively stable 8% • Drafted additional closure protocol • Total Costs = $292,14 3% • Currently reviewing other options • Costs/Pound = $1.41 5% HHW Cost/Pounds Hou ousehold Hazardous Waste (Jan.-Oct.) 350,000 $1.70 $328,382 • Budget $309,381 $280,982 $292,142 $1.65 $286,137 300,000 $1.65 • 2016 budget increased 4.4% ($14,000) to $325,000 $1.60 $1.61 Cost Per Pound Costs/Pounds 250,000 $1.59 • Intended to provide long term sustainability coupled with implemented $1.55 changes 200,000 $1.50 • 2017 = $325,000 $1.50 $1.45 150,000 • No further increased anticipated (long term) $1.40 100,000 $1.41 • Will need to institute additional changes $1.35 50,000 • Working with vendor (VES) $1.30 206,711 0 $1.25 170,733 194,645 203,426 191,167 2012 2013 2014 2015 2016 Sum of Total lbs. for Month Sum of Total Cost for Month Cost Per Pound 4

  5. 12/15/2016 Yard & Woo ood Waste Comp Compostin ing Electronic ics & Applia liance Recyclin ing 2017 Event Schedule THANK YOU! • Reminder Month Date Time Location Location Address • 2016 events successful • Community cost share increases to $6/ton for 2017 January 14 9am-12pm City of Brookfield 19700 Riverview Drive February 11 9am-12pm City of Oconomowoc 630 South Worthington Street • 2017 collection schedule March 11 9am-12pm New Berlin 16550 W. National Ave April 8 9am-12pm Village of Hartland 701 Progress Drive completed May 13 9am-12pm City of Muskego W182 S8200 Racine Ave June 10 9am-12pm City of Pewaukee TBD • 2017 Fees will increase: Compost Site Report (Jan.-Nov.) July 8 9am-12pm City of Brookfield 19700 Riverview Drive • $25/television August 12 9am-12pm Town of Merton N78 W32101 Peterson Road. September 9 9am-12pm City of Muskego W182 S8200 Racine Ave Year Municipal Cost County Cost Total Cost Total Tons • $10/CRT computer monitor October 14 9am-12pm Village of Hartland 701 Progress Drive 2015 $6,949 $37,366 $44,316 3,665 November 11 9am-12pm City of Pewaukee TBD December 9 9am-12pm City of Oconomowoc 630 South Worthington Street 2016 $14,502 $33,057 $47,540 3,863 Difference 7.28% 5.39% 2016 2016 Elec ectronics cs and nd Appl Appliance ce Co Collect ction Municipality Total Collected Product in LBS Total Cars Total Pounds Collected (Itemized) (January-November) *City of Brookfield 919 110,741 1155 *City of Oconomowoc 115 29,247 198 141,000 121,000 City of New Berlin 135 45,021 403 226,291 101,000 *Village of Hartland 1169 107,714 1036 81,000 *City of Muskego 685 78,214 368 61,000 *City of Pewaukee 1173 116,435 1031 93,522 41,000 Town of Merton 449 42,326 327 58,420 21,000 39,400 32,175 Grand Total 4645 529,698 4518 5,580 3,150 4,750 3,595 8,794 20,680 8,760 10,161 3,325 4,650 5,330 1,000 *Hosted 2 events City of Muskego second event did not have car count Thank you! 5

Download Presentation
Download Policy: The content available on the website is offered to you 'AS IS' for your personal information and use only. It cannot be commercialized, licensed, or distributed on other websites without prior consent from the author. To download a presentation, simply click this link. If you encounter any difficulties during the download process, it's possible that the publisher has removed the file from their server.

Recommend


More recommend