Water, water everywhere, but not a [safe] drop to drink! Achieving - - PowerPoint PPT Presentation
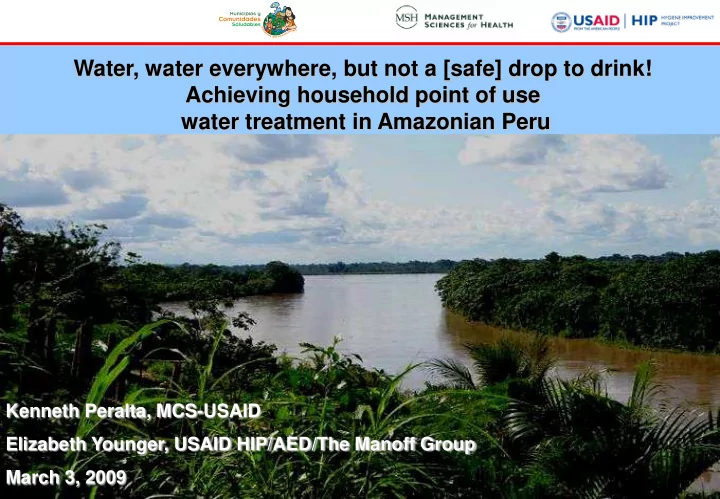
Water, water everywhere, but not a [safe] drop to drink! Achieving household point of use water treatment in Amazonian Peru Kenneth Peralta, MCS-USAID Elizabeth Younger, USAID HIP/AED/The Manoff Group March 3, 2009 IMPLEMENTATION ZONE Pilot
IMPLEMENTATION ZONE
Pilot and At-Scale Implementation Areas Healthy Municipalities and Communities Project
REGION SAN MARTIN REGION UCAYALI REGION JUNIN REGION HUANUCO
PILOT Curimana
REGION AYACUCHO REGION CUSCO
CURIMANÁ DISTRICT: TYPICAL HOUSES AND PLAZA
CURIMANÁ DISTRICT: WATER MANAGEMENT AND SOURCES
PRIMARY GOAL
- SAFE WATER
– Household treatment – Safe transportation, storage and use
SECONDARY PROJECT GOALS
Hand washing Proper feces disposal
CHRONOLOGY: PROJECT DEVELOPMENT
2006 2007 2008
Research
- Water Quality
- Behavioral
- Intervetnion
Design
- Materials
Development
- Pilot
At Scale Roll Out
July 2006 Establish MSH/HIP Agreement 2009
Fecal Coliform Contamination WATER QUALITY
RESEARCH
- BEHAVIORS:
- Transport
- Treatment
- Storage
- Serving
- PERCEPTIONS/BELIEFS
- Water Quality
- Water Access
- Diarrhea
BEHAVIORAL INTERVIEWS (mothers of children <5 years old)
RESEARCH
Bo iling
So me time s 4% YE S 12% (c hild re n/ e ld e rly) No 84 %
CHL ORINAT ION
So me time s 12% YE S 4% No 84%
OT HE R ME T HODS
Se ttling & De c a nting Clo th F iltra tio n Aluminum sulfa te flo c c ula nt Opuntia
Key Findings
RESEARCH
KEY FACTORS:
- Taste
- Time
- Cost
- Water characteristics
- Household habits
Water Treatment RESEARCH
Evidence Based Programing
INTERVENTION FOCUS
- Water Treatment
- Chlorination
- Boiling
- SODIS
- Water Retrieval and Transport
- Water Storage
- Serving Water
- When treated water is consumed
- Who drinks treated water
Small Do-Able Steps
TECHNICAL TEAM
- MCS
- HIP
Train
COMMUNITY VOLUNTEERS (JVC) Community Volunteers Local Government Health Post Staff
Implement Activities With
FAMILIES IN COMMUNITY
1 Workshop 4 Meetings
Follow-up and Monitoring
Program Design
TRAINING MATERIALS
Training Manual Training Posters Interactive Games
MATERIALS USED IN COMMUNITY
Reference Guide Reminder Brochures
X O
DATA COLLECTION SYSTEM
BAR GRAPHS
RESULTS
INFANT HEALTH INDICATORS Bi-Annual Data Points in 2006 - 2008
26.8 31.9 48.3 49.9 60.0
65.9
10 20 30 40 50 60 70 80 90 100 Children < 2 consuming safe water
I sem 2006 II sem 2006 I sem 2007 II sem 2007 I sem 2008 II sem 2008
Total children < 2 years Total children < 6 months
Source: Community self evaluación, Management Information System MCS-Perú / 2006 – 2008
%
Communities 528 533 525 520 508 514
5,746 6,909 7,853 5,719 5,592 5,635 1,497 1,661 1,977 1, 369 1, 377 1,539
ROLL OUT
- 7 REGIONS
- 557 COMMUNITIES
- 37,000 FAMILIES
CONTACT INFORMATION
- KENNETH PERALTA (MCS/USAID)
– Kperalta@msh.org – Skype: kenneth.peralta – www.comunidadsaludable.org – www.msh.org
- ELIZABETH YOUNGER (HIP/USAID)