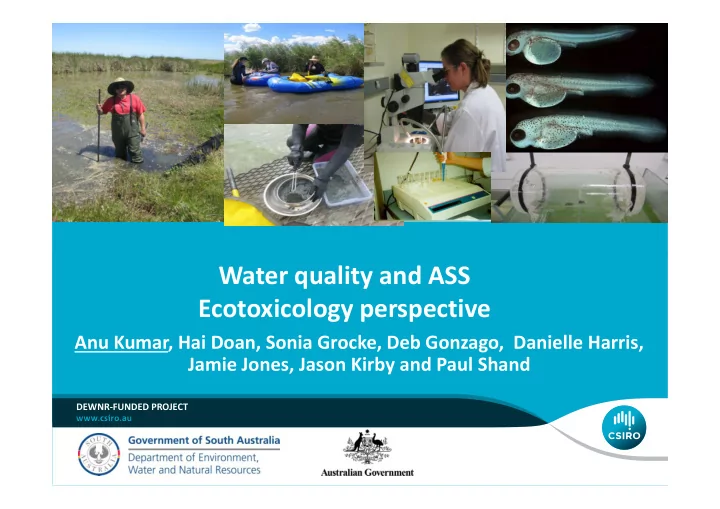

Water quality and ASS Ecotoxicology perspective Anu Kumar, Hai Doan, Sonia Grocke, Deb Gonzago, Danielle Harris, Jamie Jones, Jason Kirby and Paul Shand DEWNR-FUNDED PROJECT
Use of bioindicators
Direct toxicity assessment-surface water Fish Sites Microbial Alga Water flea Shrimp larvae Dog Lake LT NT LT NT NT Point Strut North LT NT LT NT LT Artificial water NT NT NT NT NT LT: Low toxicity T: Moderate to high toxicity HT- very high toxicity NT: No toxicity NOEC >60% NOEC >60% NOEC 60-10% NOEC 60-10% NOEC <10% NOEC <10% Presentation title | Presenter name | Page 3
Sediment Toxicity Assessment • Baseline concentrations at a pristine location; • Mapping the contaminant distribution in sediments in a water body • Determining the impact of known inputs • Determining the impact of known inputs • Assessing sediments requiring remediation 3305 ENVIRONMENTAL TOXICOLOGY AND REMEDIATION
CSIRO: Aquatic Ecotoxicology
1. Are contaminants generated in the system? 2. Are contaminants bioavailable? 3. Is there a measurable response? 4. Are the contaminants causing this response?
1-TRIAD Approach COLLABORATIVE WORK WITH SA-EPA
Midge toxicity- whole sediment test 150 18 % Emergence % Survival 16 % Male Length (mm) 100 % Female %total 14 Length (mm) 50 12 12 0 10 Red arrows represent significant effects
1- TRIAD Approach Mostly un-impacted sites- recovered 17 sites sampled in March and Nov 2013 Integrated Assessment of the Ecosystem Health Toxicity Chemical analyses bioassays Bioaccumulation Benthic community composition 3305 ENVIRONMENTAL TOXICOLOGY AND REMEDIATION ( Chapman 1990, 1997, 2000)
Photo by David Robertson (2007), Photo by David Robertson (2007), provided by Peter Teasdale, Griffith University) 2- Deeper sediment layers?
Direct toxicity assessment – Pore-water Water flea Water flea Water samples Microbial Acute Chronic Boggy Creek (0-3 cm depth) T NT LT Boggy Creek (3-13 cm depth) T T HT Boggy Creek (13-27 cm depth) LT T HT Boggy Creek- (27-47 cm depth) T T HT Point Sturt North (0-12 cm depth) Point Sturt North (0-12 cm depth) NT NT NT NT LT LT Point Sturt North (12-25 cm depth) LT T HT Point Sturt North (25-42 cm depth) T HT HT Point Sturt North (42-67 cm depth) T NT LT River water NT NT NT NT: No toxicity LT: Low toxicity T: Moderate to high toxicity HT- very high toxicity NOEC >100-90% NOEC 89-49% NOEC 50-10% NOEC <10% Presentation title | Presenter name | Page 13
2- Deeper sediment layers? Contaminants generated at the ASS impacted sites at deeper sediment depths if bioavailable, could be severely toxic to aquatic organisms . toxic to aquatic organisms .
3- In-situ assessment-caging studies 3- In-situ assessment-caging studies Snail, yabby, mussel and shrimp
Snail growth in surface water collected from sites weekly collection of snails The red line shows the 900.00 minimum length of the snails 800.00 reared fully under the Length (µm) laboratory conditions . 700.00 (ranged from 900-1100) µm 600.00 Dog Lake 500.00 Average Len 400.00 400.00 Poltalloch Poltalloch 300.00 Pt. Sturt Nth 200.00 Wally's Landing 100.00 0.00 1 2 3 4 Week
Mussel thickness shell thinning observed at all sites In-situ Mussel Shell Thickness 1.6 1.4 Thickness (mm) 1.2 1 0.8 Average Thic Week 4 Week 4 0.6 Week 8 0.4 0.2 0 Control Dog Lake Pt Sturt Nth Poltalloch Wally's Landing
Body burden- Mussel and yabby tissue Al Al 10000 1800 1600 g mussel tissue) 1000 ration (mg/kg) 1400 1200 1000 100 Al (mg/kg m Concentrat 800 600 10 400 200 1 0 Control Dog L Polt Pt. St W.Land Control Dog L Polt Pt. St. W.Land Week 4 Control Control Week 4 Week 8 Week 8
1.Lower Lakes recovering 2.Flows are important to maintain ecosystem health 3.Ecotoxicological approaches are successful in identifying hotspots and contaminants responsible for the adverse Now Now effects . effects . If in near future?
Thank you Thank you Anu Kumar Mitigation and Technologies Group Leader- Contaminant t +61 8 8303 8597 Biogeochemistry and Environmental e anupama.kumar@csiro.au Toxicology w www.clw.csiro.au Program- Environmental Contaminant LAND AND WATER FLAGSHIP
Recommend
More recommend