Water Measurement Presentation Some Units for Describing Water - - PowerPoint PPT Presentation

water measurement presentation
SMART_READER_LITE
LIVE PREVIEW

Water Measurement Presentation Some Units for Describing Water - - PowerPoint PPT Presentation

Water Measurement Presentation Some Units for Describing Water Acre-foot [af]: volume of water which inundates one acre Compact Implementation Technical Team to a depth of one foot. Commonly used for reservoirs and seasonal volumes in canals or


slide-1
SLIDE 1

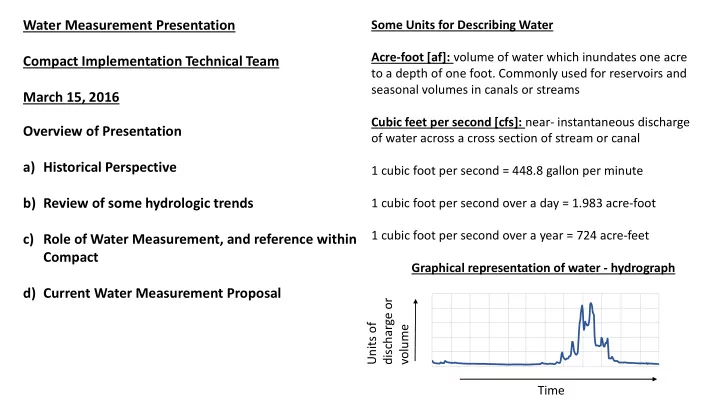
Some Units for Describing Water Acre-foot [af]: volume of water which inundates one acre to a depth of one foot. Commonly used for reservoirs and seasonal volumes in canals or streams Cubic feet per second [cfs]: near- instantaneous discharge

  • f water across a cross section of stream or canal

1 cubic foot per second = 448.8 gallon per minute 1 cubic foot per second over a day = 1.983 acre-foot 1 cubic foot per second over a year = 724 acre-feet Graphical representation of water - hydrograph

Water Measurement Presentation Compact Implementation Technical Team March 15, 2016 Overview of Presentation a) Historical Perspective b) Review of some hydrologic trends c) Role of Water Measurement, and reference within Compact d) Current Water Measurement Proposal

Time Units of discharge or volume

slide-2
SLIDE 2

1860 1875 1890 1905 1920 1935

1865 – High water year, flooding documented in western Montana papers. Portland, Ore. floods 1860’s-1870’s – Indian irrigation ditches constructed in Jocko Valley, Vanderburg Ditch on Finley Creek - 1864 Around 1885, headworks and canal started at present location of Jocko K Canal 1894 – Flood of record, lower Flathead River = 110,000 cfs; next largest flood 1928 = 82,800 cfs 1906 – 1918 – early U.S. Geological Survey streamflow records Jocko, Mission, Little Bitterroot Valley, records available on USGS website Much of the measurement predates FIIP irrigation diversion 1908 – Flood of record for much of Western Montana, Jocko River 7,500 cfs; Post Creek 2,800 cfs 1928 – Regional high water year, including Reservation 1916 – Regional high water year, including Reservation 1929 - 1944 – Most severe continuous drought in measured record for Montana

Historical Perspective

slide-3
SLIDE 3

1935 1950 1965 1980 1995 2010

1939 through 1946 – Compilations of water supply and water use for FIIP prepared by US Indian Irrigation Service and USDOI Office of Indian Affairs Irrigation Division 1941 and 1944 – Droughts of record for western Montana Starting in 1940’s, FIIP initiated stream and canal measurement program Approximately 70 ratings were developed spanning into 1960’s. Records indicate measurement program very limited after 1960’s 1948 – Regional flood year, second largest recorded flood on Jocko River 1964 – Regional flood year, FIIP Project Engineer reports 3.92” rain in 42 hours, many FIIP canals and headworks destroyed 1974 – Regional flood year 1982 – CSKT Water Measurement Program starts. USGS cooperative program starts, USGS stream gaging information available 1982 - present 1987 – Measurement and compliance for Interim Instream Flow and Minimum Reservoir pool levels begins 1987 and 1988 - Severe drought in western Montana 1997 – High water year, Jocko River peaks at 2,710 cfs 2001 – Drought, one of five lowest water years on record 1992 – Severe single year drought 2011- volumetrically very high water year, similar to 1997 – sustained high flows 2015 – Low water year, very below average snowpack, below average precipitation, above average temperatures, strong el nino signature through later 2015 carrying into 2016 2005 – Very elevated peak flows – driven by rain event, not snowmelt

slide-4
SLIDE 4

Northwest Montana watersheds are considered either snow-dominated or rain and snow dominated

Typically > 75 % of surface runoff comes as snowmelt in the April – July period This pattern is widely recognized to be changing, with earlier runoff and a greater percent of precipitation

  • ccurring as rainfall
slide-5
SLIDE 5

20 25 30 35 40 45 50 55 60 65

1895 1898 1901 1904 1907 1910 1913 1916 1919 1922 1925 1928 1931 1934 1937 1940 1943 1946 1949 1952 1955 1958 1961 1964 1967 1970 1973 1976 1979 1982 1985 1988 1991 1994 1997 2000 2003 2006 2009

annual temperatures, in degrees f

average annual maximum annual average average annual minimum

Snow observations are consistent with longer-term temperature data Missoula first order weather station (USC00245740) Air temperature data 1895 – 2015 For each trend line air temperature has increased by approximately 1.5 degrees Fahrenheit over the time period

slide-6
SLIDE 6

8.77 12.83

5 10 15 20 25 30 1909 1912 1915 1918 1921 1924 1927 1930 1933 1936 1939 1942 1945 1948 1951 1954 1957 1960 1963 1966 1969 1972 1975 1978 1981 1984 1987 1990 1993 1996 1999 2002 2005 2008 2011 2014 annual precipitation, in inches

Saint Ignatius weather station Precipitation patterns a) Monthly precipitation patterns using 1909 – 2015 average monthly values b) Average annual precipitation for 1909 – 2015 period (average = 15.84 inches). Orange is trend line. a) 1935 lowest annual precipitation in 107 year period; b) 2015 24th lowest annual precipitation in last 107 years

a) b)

6% 5% 6% 9% 14% 15% 7% 7% 9% 8% 7% 6%

0% 2% 4% 6% 8% 10% 12% 14% 16% 0.00 0.50 1.00 1.50 2.00 2.50 Jan Feb Mar Apr May Jun Jul Aug Sep Oct Nov Dec average monthly precipitation, as percent of average annual precipitation Average monthly precipitation, in inches

slide-7
SLIDE 7

0% 5% 10% 15% 20% 25% 30% 35% 1909 1912 1915 1918 1921 1924 1927 1930 1933 1936 1939 1942 1945 1948 1951 1954 1957 1960 1963 1966 1969 1972 1975 1978 1981 1984 1987 1990 1993 1996 1999 2002 2005 2008 2011 2014 March-April precipitation as percent of annual precipitation

c) St Ignatius station December – February precipitation as percent of each years annual precipitation (average = 18%). Orange is trend line d) St Ignatius station March and April precipitation as percent of each years annual precipitation (average = 16%). Orange is trend line

d) c)

0% 5% 10% 15% 20% 25% 30% 35% 40% 45% 50% 1909 1912 1915 1918 1921 1924 1927 1930 1933 1936 1939 1942 1945 1948 1951 1954 1957 1960 1963 1966 1969 1972 1975 1978 1981 1984 1987 1990 1993 1996 1999 2002 2005 2008 2011 2014 December-February precipitation as percent of annual precipitation

2015

slide-8
SLIDE 8

e) St Ignatius station May and June precipitation as percent of each years annual precipitation (average = 30%). Orange is trend line f) St Ignatius station July and August precipitation as percent

  • f each years annual

precipitation (average = 14%). Orange is trend line

0% 10% 20% 30% 40% 50% 60% 70% 1909 1912 1915 1918 1921 1924 1927 1930 1933 1936 1939 1942 1945 1948 1951 1954 1957 1960 1963 1966 1969 1972 1975 1978 1981 1984 1987 1990 1993 1996 1999 2002 2005 2008 2011 2014

May-June precipitation as percent of annual precipitation 0% 5% 10% 15% 20% 25% 30% 35% 40% 1909 1912 1915 1918 1921 1924 1927 1930 1933 1936 1939 1942 1945 1948 1951 1954 1957 1960 1963 1966 1969 1972 1975 1978 1981 1984 1987 1990 1993 1996 1999 2002 2005 2008 2011 2014 July -August precipitation as percent of annual precipitation

e) f) 2015

slide-9
SLIDE 9

0% 5% 10% 15% 20% 25% 30% 35% 40% 45% 1909 1912 1915 1918 1921 1924 1927 1930 1933 1936 1939 1942 1945 1948 1951 1954 1957 1960 1963 1966 1969 1972 1975 1978 1981 1984 1987 1990 1993 1996 1999 2002 2005 2008 2011 2014 Sept-Nov precipitation as percent of annual precipitation

g) September – November precipitation as percent of each years annual precipitation (average = 23%). Orange is trend line

g) 2015

slide-10
SLIDE 10
  • 400,000
  • 300,000
  • 200,000
  • 100,000

100,000 200,000 300,000 400,000 500,000 600,000 departure relative to 1923 - 2014 average (837,575 acre-feet)

  • 300,000
  • 200,000
  • 100,000

100,000 200,000 300,000 3 year moving average of departure from 1923 - 2015 average, in af

Swan River at Bigfork USGS station 12337000 Long-term representative natural flow gage for region Surplus – deficit plots a) Shows (+ or –) departure

  • f yearly average flow

volume from long-term average flow volume. Orange is trend line b) 3-year moving average smooths annual values helping to illustrate multi- year patterns, such as droughts of 1940’s and early 2000’s

a) b)

slide-11
SLIDE 11

58% 55%

0% 10% 20% 30% 40% 50% 60% 70% 80% 90% April - September runoff as percent of annual runoff

Swan River at Bigfork USGS station 12337000 April – September runoff volume as percent of annual runoff volume (average = 76%) Red bars 1934; 58 % 2015; 55 % 2015 – earliest peak on record March 19th Orange is trend line April - September runoff is decreasing as percent of annual runoff volume at this station

slide-12
SLIDE 12

10,000 20,000 30,000 40,000 50,000 60,000 70,000 80,000 90,000 annual runoff, in acre-feet (average = 43,850 acre-feet) 2,000 4,000 6,000 8,000 10,000 12,000 14,000 16,000 18,000 annual runoff, in acre-feet (average = 6,600 acre-feet)

a)

Natural Flows on Reservation a) Annual runoff South Fork Jocko River (USGS gage 12381400) b) Annual runoff Mill Creek (USGS gage 12372450)

b) Post- Chippy Creek fire

slide-13
SLIDE 13

5,000 10,000 15,000 20,000 25,000 30,000 35,000 40,000 annual runoff, in acre-feet (average = 22,050 acre-feet)

Regulated Flows on Reservation a) Annual runoff Middle Fork Jocko River (CSKT gage 5100.00). Average diversion from Placid Creek into Jocko Reservoirs = 6,495 acre-feet b) Average daily discharge hydrograph Middle Fork Jocko River (CSKT gage 5100.00) for a) 1997 – wet year b) 2001 – dry year c) 2006 - ~ average year High flows in MF shifted to later in summer due to reservoir releases

a) b)

50 100 150 200 250 300 350 400 450 500 1-Oct 1-Nov 1-Dec 1-Jan 1-Feb 1-Mar 1-Apr 1-May 1-Jun 1-Jul 1-Aug 1-Sep average daily discharge, in cfs

1997 2001 2006

period when reservoir releases moved down river

slide-14
SLIDE 14

50 100 150 200 250 average daily discharge, in cfs

USGS natural flow gage below South Crow Feeder below Pablo Feeder

100 200 300 1-Oct 1-Nov 1-Dec 1-Jan 1-Feb 1-Mar 1-Apr 1-May 1-Jun 1-Jul 1-Aug 1-Sep average daily discharge, in cfs

USGS natural flow gage below South Crow Feeder below Pablo Feeder

50 100 150 200 250 300 average daily discharge, in cfs

USGS natural flow gage below South Crow Feeder below Pablo Feeder

100 200 300 average daily discharge, in cfs

USGS natural flow gage below South Crow Feeder below Pablo Feeder

Two views of downstream flow patterns for South Crow Creek a) Wet year – 1997 b) Dry year - 2001

a) b)

Pablo feeder South Crow Creek

slide-15
SLIDE 15

50 100 150 200 250 Apr-09 May-09 Jun-09 Jul-09 Aug-09 Sep-09 Oct-09 Nov-09 Dec-09 Jan-10 Feb-10 Mar-10 Apr-10 May-10 Jun-10 Jul-10 Aug-10 Sep-10 Oct-10 Nov-10 Dec-10 average daily discharge, in cfs 5 10 15 20 25 30 average daily discharge, in cfs

Little Bitterroot Watershed a) Little Bitterroot River near Niarada 1909 – 1910 USGS gage 12374000: snowmelt – patterned hydrograph b) Little Bitterroot River 2010 – moderate dry year a) Blue – below Camas A Canal b) Orange near mouth c) Summer period for 2010

a) b) c)

5 10 15 20 25 30 15-Apr 15-May 15-Jun 15-Jul 15-Aug 15-Sep Average daily discharge, in cfs

609 sq mile drainage area at mouth

slide-16
SLIDE 16

5,000 10,000 15,000 20,000 25,000 5,000 10,000 15,000 20,000 10,000 20,000 30,000 40,000 50,000 60,000

Annual diversion, in acre-feet

Canal diversion records

a) Camas A Canal below Mill Creek b) Moiese A Canal below Headworks c) Pablo Feeder Canal below Pablo Drop above Flathead Pump Canal

b) a) c)

slide-17
SLIDE 17

Water measurement is key element for water management

a) Complexity of surface water supply for FIIP. Unlike many irrigation projects, FIIP relies on a large number of smaller sources to produce an aggregate water supply b) Complexity of canal network [approximately 1 mile of maintained canal for every 128 irrigated acres] c) Variability of annual water supply and the timing of water supply d) Limitations of Reservoir storage capacity e) Competing demands for a limited water supply – federal irrigation project, extensive private irrigation, instream flows

Area ~ average runoff derived from mountain runoff Maximum storage volume Storage as % of ~ average runoff Jocko 198,000 acre-feet/year 11,697 acre-feet 5.9 % Mission 215,000 acre-feet/year 106,988 acre-feet 49.8 % Little Bitterroot 39,000 acre-feet/year 45,351 acre-feet 116.3 %

slide-18
SLIDE 18

Compact References to Water Measurement a) Articles IV. C., D., and E., recognize the role of water measurement and Article IV.F confirms this, explicitly identifying comprehensive water measurement as essential b) Appendix 3.5, CITT responsibilities – identifies water measurement as a task in several locations c) Appendices 3.1 – 3.7 are, in part, based on water measurement activities d) Instream flows, River Diversion Allowances and determination of wet through dry year-types are all based on active water measurement

slide-19
SLIDE 19

Water Measurement Proposal - Builds on current CSKT Water Measurement Program

a) Program currently maintain 38 stream stations and 25 canal stations b) Program has tracked compliance at 28 interim instream flow locations for the last 30 years c) Twenty of the currently measured stream stations are identified as instream flow [MEF/TIF] locations in the Compact d) Twenty of the currently measured canal stations are identified as River Diversion Allowance locations in the Compact e) Three of the currently measured irrigation return flows are maintained to help FIIP comply with the Biological Opinion for Operation and Maintenance of the Project f) Forty five current stations are telemetered and the Program is working to expand telemetered sites and improve the website for data viewing

slide-20
SLIDE 20

Water Measurement Proposal - Perspective

a) Meet the Compact requirements for River Diversion Allowance and Instream Flow measurement locations b) Meet the Compact requirements for natural flow measurement locations to determine wet through dry water year types c) Add a small subset of larger irrigation return flow stations to track progress d) Apply a lower intensity monitoring protocol at locations with low flow volumes and/or headworks management that does not require system-level coordination e) Upgrade all measurement locations to telemetry f) Provide universal access to telemetered data via website g) Over time install artificial controls at canal measurement locations to reduce long-term costs and improve operational control on canals

slide-21
SLIDE 21

Water Measurement Proposal - Numbers Location type Existing with telemetry New with telemetry Upgrade to telemetry Monitoring protocol Instream flow 14 1 6 11 River diversion allowance 16 17 4 8 Natural flow 7 3 Irrigation return flow 3 3

slide-22
SLIDE 22

Water Measurement Proposal - Locations

Station name Station type Measurement plan

Middle Fork Jocko River IIF/MEF/TIF Existing equipment North Fork Jocko River IIF/ MEF/TIF Existing equipment Falls Creek below Tabor Feeder MEF/TIF Monitoring protocol S-14 Creek below Tabor Feeder MEF/TIF Monitoring protocol

Tables in measurement proposal

http://dnrc.mt.gov/divisions/reserved-water-rights-compact- commission/cskt-montana-compact-technical-team-meeting- information

Tables in Compact Appendices

http://dnrc.mt.gov/divisions/reserved-water-rights-compact- commission/confederated-salish-and-kootenai-tribes

slide-23
SLIDE 23

Water Measurement Proposal – Locations Maps attached to proposal Budget and Schedule found in proposal