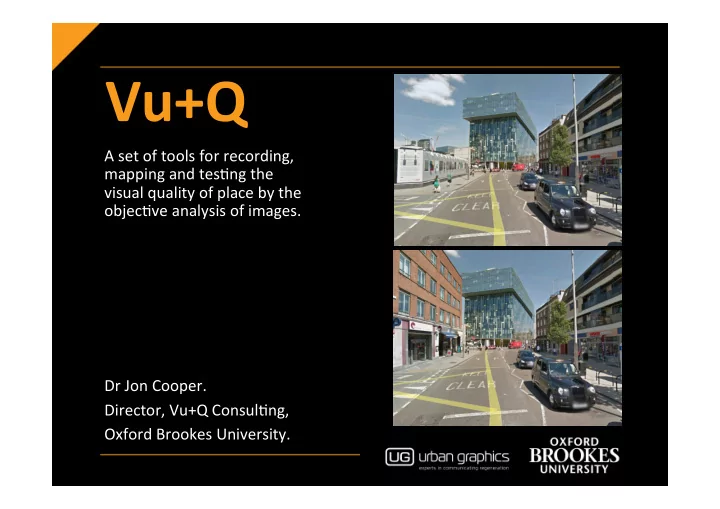
Vu+Q A set of tools for recording, mapping and tes3ng - - PowerPoint PPT Presentation

vu q
SMART_READER_LITE
LIVE PREVIEW

Vu+Q A set of tools for recording, mapping and tes3ng - - PowerPoint PPT Presentation

Vu+Q A set of tools for recording, mapping and tes3ng the visual quality of place by the objec3ve analysis of images. Dr Jon Cooper.


slide-1
SLIDE 1

Vu+Q ¡

A ¡set ¡of ¡tools ¡for ¡recording, ¡ mapping ¡and ¡tes3ng ¡the ¡ visual ¡quality ¡of ¡place ¡by ¡the ¡
  • bjec3ve ¡analysis ¡of ¡images. ¡
Dr ¡Jon ¡Cooper. ¡ Director, ¡Vu+Q ¡Consul3ng, ¡ ¡ Oxford ¡Brookes ¡University. ¡ ¡
slide-2
SLIDE 2 Vu+Q ¡calcula3ng ¡and ¡mapping ¡the ¡visual ¡quality ¡of ¡place ¡ Places, ¡Streets ¡and ¡Spaces ¡are ¡complex ¡and ¡irregular! ¡
slide-3
SLIDE 3 Vu+Q ¡calcula3ng ¡and ¡mapping ¡the ¡visual ¡quality ¡of ¡place ¡
slide-4
SLIDE 4 Vu+Q ¡calcula3ng ¡and ¡mapping ¡the ¡visual ¡quality ¡of ¡place ¡
slide-5
SLIDE 5 Vu+Q ¡calcula3ng ¡and ¡mapping ¡the ¡visual ¡quality ¡of ¡place ¡
slide-6
SLIDE 6 Vu+Q ¡calcula3ng ¡and ¡mapping ¡the ¡visual ¡quality ¡of ¡place ¡
slide-7
SLIDE 7 Vu+Q ¡calcula3ng ¡and ¡mapping ¡the ¡visual ¡quality ¡of ¡place ¡
slide-8
SLIDE 8

What ¡ Why ¡ How ¡ ¡

Vu+Q ¡calcula3ng ¡and ¡mapping ¡the ¡visual ¡quality ¡of ¡place ¡
slide-9
SLIDE 9

What ¡

Vu+Q ¡calcula3ng ¡and ¡mapping ¡the ¡visual ¡quality ¡of ¡place ¡
slide-10
SLIDE 10

What:. ¡

Proven ¡ indicator ¡of ¡ visual ¡quality ¡ Composite ¡ indicator ¡of ¡visual ¡ complexity ¡ variety ¡and ¡ intensity ¡ Iden;fying ¡the ¡ interes;ng ¡the ¡ dull ¡and ¡the ¡
  • verly ¡complex ¡
Vu+Q ¡calcula3ng ¡and ¡mapping ¡the ¡visual ¡quality ¡of ¡place ¡
slide-11
SLIDE 11

Why ¡

Vu+Q ¡calcula3ng ¡and ¡mapping ¡the ¡visual ¡quality ¡of ¡place ¡
slide-12
SLIDE 12

Why:. ¡

> ¡ > ¡ > ¡ Vu+Q ¡calcula3ng ¡and ¡mapping ¡the ¡visual ¡quality ¡of ¡place ¡
slide-13
SLIDE 13

How ¡

Vu+Q ¡calcula3ng ¡and ¡mapping ¡the ¡visual ¡quality ¡of ¡place ¡
slide-14
SLIDE 14

How: ¡a ¡new ¡indicator. ¡

Vu+Q ¡calcula3ng ¡and ¡mapping ¡the ¡visual ¡quality ¡of ¡place ¡
slide-15
SLIDE 15

How: ¡a ¡new ¡indicator. ¡

80% ¡

Correla3on ¡between ¡Cvi ¡and ¡VQ ¡

Vu+Q ¡calcula3ng ¡and ¡mapping ¡the ¡visual ¡quality ¡of ¡place ¡
slide-16
SLIDE 16

How: ¡method. ¡

Image ¡capture ¡ & ¡prepara;on ¡ Measurement ¡ calcula;on ¡and ¡ analysis ¡ Data ¡storage ¡ Mapping ¡ Vu+Q ¡calcula3ng ¡and ¡mapping ¡the ¡visual ¡quality ¡of ¡place ¡
slide-17
SLIDE 17 Mapping ¡the ¡ exis;ng ¡ ¡ Establishing ¡and ¡ calibra;ng ¡VQ ¡ with ¡Cvi ¡

How:. ¡

Survey ¡ Assessment ¡ ¡ Percep3on ¡

Tes;ng ¡ proposals ¡ Vu+Q ¡calcula3ng ¡and ¡mapping ¡the ¡visual ¡quality ¡of ¡place ¡
slide-18
SLIDE 18

Survey: ¡

Vu+Q ¡calcula3ng ¡and ¡mapping ¡the ¡visual ¡quality ¡of ¡place ¡
slide-19
SLIDE 19

Survey: ¡

Vu+Q ¡calcula3ng ¡and ¡mapping ¡the ¡visual ¡quality ¡of ¡place ¡
slide-20
SLIDE 20

Survey: ¡street ¡summary: ¡

Vu+Q ¡calcula3ng ¡and ¡mapping ¡the ¡visual ¡quality ¡of ¡place ¡
slide-21
SLIDE 21

Survey: ¡street ¡summary: ¡

Vu+Q ¡calcula3ng ¡and ¡mapping ¡the ¡visual ¡quality ¡of ¡place ¡
slide-22
SLIDE 22

Survey: ¡street ¡summary: ¡

Vu+Q ¡calcula3ng ¡and ¡mapping ¡the ¡visual ¡quality ¡of ¡place ¡
slide-23
SLIDE 23

Survey: ¡Vista ¡

Vu+Q ¡calcula3ng ¡and ¡mapping ¡the ¡visual ¡quality ¡of ¡place ¡
slide-24
SLIDE 24

Survey: ¡Oblique ¡

Vu+Q ¡calcula3ng ¡and ¡mapping ¡the ¡visual ¡quality ¡of ¡place ¡
slide-25
SLIDE 25

Survey: ¡Eleva3on ¡

Vu+Q ¡calcula3ng ¡and ¡mapping ¡the ¡visual ¡quality ¡of ¡place ¡
slide-26
SLIDE 26

Assessment: ¡

Vu+Q ¡calcula3ng ¡and ¡mapping ¡the ¡visual ¡quality ¡of ¡place ¡
slide-27
SLIDE 27

Assessment: ¡Exis3ng. ¡

Vu+Q ¡calcula3ng ¡and ¡mapping ¡the ¡visual ¡quality ¡of ¡place ¡
slide-28
SLIDE 28

Assessment: ¡A ¡

Vu+Q ¡calcula3ng ¡and ¡mapping ¡the ¡visual ¡quality ¡of ¡place ¡
slide-29
SLIDE 29

Assessment: ¡B ¡

Vu+Q ¡calcula3ng ¡and ¡mapping ¡the ¡visual ¡quality ¡of ¡place ¡
slide-30
SLIDE 30

Assessment: ¡C ¡

Vu+Q ¡calcula3ng ¡and ¡mapping ¡the ¡visual ¡quality ¡of ¡place ¡
slide-31
SLIDE 31

Assessment: ¡D ¡

Vu+Q ¡calcula3ng ¡and ¡mapping ¡the ¡visual ¡quality ¡of ¡place ¡
slide-32
SLIDE 32

Percep3on: ¡

Vu+Q ¡calcula3ng ¡and ¡mapping ¡the ¡visual ¡quality ¡of ¡place ¡
slide-33
SLIDE 33

Percep3on ¡

Vu+Q ¡calcula3ng ¡and ¡mapping ¡the ¡visual ¡quality ¡of ¡place ¡
slide-34
SLIDE 34

Percep3on ¡

Vu+Q ¡calcula3ng ¡and ¡mapping ¡the ¡visual ¡quality ¡of ¡place ¡
slide-35
SLIDE 35

Percep3on ¡

Vu+Q ¡calcula3ng ¡and ¡mapping ¡the ¡visual ¡quality ¡of ¡place ¡
slide-36
SLIDE 36

Summary ¡

Vu+Q ¡calcula3ng ¡and ¡mapping ¡the ¡visual ¡quality ¡of ¡place ¡
slide-37
SLIDE 37 Vu+Q ¡calcula3ng ¡and ¡mapping ¡the ¡visual ¡quality ¡of ¡place ¡

Summary:. ¡

Helps ¡us ¡deal ¡ with ¡
  • complexity. ¡
Objec3ve ¡ decision ¡ support ¡
  • tools. ¡
Lends ¡itself ¡to ¡
  • automa3on. ¡
Indicates ¡ ¡ visual ¡quality ¡ and ¡dynamic ¡ experience ¡of ¡
  • place. ¡

Vu+Q ¡

Cvi ¡ 8.26 ¡ Cvi ¡ 8.60 ¡ > ¡ > ¡
slide-38
SLIDE 38 If ¡you ¡would ¡like ¡more ¡informa3on ¡on ¡Vu+Q ¡then ¡please ¡ contact ¡ Dr ¡Jon ¡Cooper ¡ ¡ vuq@brookes.ac.uk ¡