
SLIDE 1
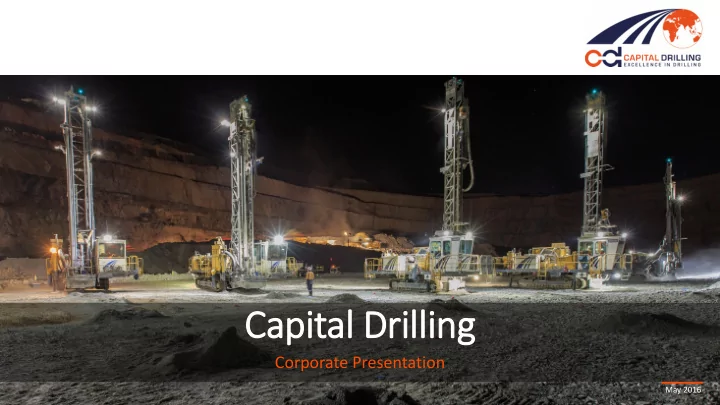
Capital D l Drilli illing
Corporate Presentation
May 2016
Capital D l Drilli illing Corporate Presentation May 2016 - - PowerPoint PPT Presentation
Capital D l Drilli illing Corporate Presentation May 2016 Disclaimer IMPORTANT NOTICE This document does not constitute or form part of any offer or invitation to sell or issue, or any solicitation of any offer to purchase or subscribe for,
Corporate Presentation
May 2016
IMPORTANT NOTICE
distribution form part of or be relied on in connection with any contract or investment decision relating thereto, nor does it constitute a recommendation regarding the securities of the Company.
express or implied, is given by or on behalf of the Company or any of its directors, officers or employees or any other person as to the accuracy or completeness of the information or opinions contained in this document and no liability whatsoever is accepted by the Company or any of its members, directors, officers or employees nor any other person for any loss howsoever arising, directly or indirectly, from any use of such information or opinions or otherwise arising in connection therewith.
at persons in member states of the European Economic Area who are “qualified investors” within the meaning of Article 2(1)(e) of the Prospectus Directive (Directive 2003/71/EC) (“Qualified Investors”). In addition, in the United Kingdom, this document is being distributed only to, and is directed only at, Qualified Investors (i) who have professional experience in matters relating to investments falling within Article 19(5) of the Financial Services and Markets Act 2000 (Financial Promotion) Order 2005, as amended (the “Order”) and Qualified Investors falling within Article 49(2)(a) to (d) of the Order, and (ii) to whom it may otherwise lawfully be communicated (all such persons together being referred to as “relevant persons”). This document must not be acted on or relied on (i) in the United Kingdom, by persons who are not relevant persons, and (ii) in any member state of the European Economic Area other than the United Kingdom, by persons who are not Qualified Investors. Any investment or investment activity to which this document relates is available only to (i) in the United Kingdom, relevant persons, and (ii) in any member state of the European Economic Area other than the United Kingdom, Qualified Investors, and will be engaged in only with such persons.
document nor any copy of it may be taken or transmitted into Australia, Canada, Japan or the Republic of South Africa or to any securities analyst or other person in any of those jurisdictions. Any failure to comply with this restriction may constitute a violation of United States, Australian, Canadian, Japanese or South African securities law. The distribution of this document in other jurisdictions may be restricted by law and persons into whose possession this document comes should inform themselves about, and observe, any such restrictions.
be offered or sold in the United States (as such term is defined in Regulation S under the Securities Act) unless they are registered under the Securities Act or pursuant to an exemption from, or in a transaction not subject to, the registration requirements of the Securities Act and, subject to certain exceptions, may not be offered or sold within Canada, Australia, Japan or the Republic of South Africa or to any national, resident or citizen of Canada, Australia, Japan or the Republic of South Africa. No public offer of securities in the Company is being made in the United States, Canada, Australia, Japan or the Republic of South Africa.
statements involve a number of risks, uncertainties and assumptions that could cause actual results or events to differ materially from those expressed or implied by the forward-looking statements. These risks, uncertainties and assumptions could adversely affect the outcome and financial effects of the plans and events described herein. Forward-looking statements contained in this document regarding past trends or activities should not be taken as a representation that such trends or activities will continue in the future. The Company does not undertake any obligation to update or revise any forward-looking statements, whether as a result of new information, future events or otherwise. You should not place undue reliance on forward-looking statements, which speak only as of the date of this document.
comply with the contents of this notice; and (iii) you will use the information in this document solely for evaluating your possible interest in the Company and for no other purpose. 2
3
» Exploration & delineation drilling » Grade control drilling » Blast hole drilling, including shot firing services » Underground drilling
» Acacia Mining » Anglo Gold Ashanti » Barrick Gold Corporation » BHP Billiton » Centamin » Kinross Gold
4
Q1 2016 Q1 2015 Q4 2015 % change from Q1 2015 % change from Q4 2015 Revenue ($mn) 19.1 19.1 18.9 0.0% 1.1% ARPOR ($) 181,000 191,000 185,000
Average utilised rigs 34 32 34 6.3% 0.0% Fleet Utilitsation (%) 36% 33% 35% 9.1% 2.9% Average Fleet 94 96 97
Closing fleet size 94 97 94
0.0%
ARPOR
» North Mara mobilisation » Rebuilding utilisation in exploration & delineation » Enhancing depth in Business Development
(c80% contribution from production drilling)
» Tendering pipeline showing signs of improvement
with CAPEX payments and mobilisation expenses
5
IMPROVE THE BUSINESS
Managing Costs
margins maintained Improve Operating Performance
Lean Operating Model
STRENGTHEN THE BALANCE SHEET
Capex Discipline
Maintain Working Capital Discipline
management Reduced Debt
DELIVER GROWTH
Strengthened Management Team
Additional Long Term Core Contracts
Strategy refocus
Utilisation
REBUILD UTILISATION
cash reserves
fleet, ready for deployment
work
Rebuilding utilization in exploration & delineation drilling … The Lean Operating Model
6
» High performance rigs, support equipment and full contingency of inventory to
support campaign
» Streamlined site personnel to operations only, with support functions
engineered out
» Key stakeholders engaged throughout the tendering process » Project Managed execution of mobilisation and drilling
» Dedicated start up support specialist deployed on site until operating at “steady
state”
» Ongoing performance evaluation including client agreed KPI’s
CASE STUDY: KHOEMACAU COPPER, BOTSWANA LEAN OPERATING MODEL
Rolled out across the business in 2015
Numerous successful contracts executed in H2 2015 and into 2016 Operating margins maintained despite more competitive pricing
7
High success rate on tenders submitted: Further tenders pending notification Building the future pipeline
Mauritania
Egypt
Chile
Mauritania
Tanzania
8
» Capital Drilling the incumbent grade control driller since 2008
» Extensive training programs to build skills, utilising manager trainers from
existing production sites
9
0.00 5.00 10.00 15.00 20.00 25.00 0.00 20.00 40.00 60.00 80.00 100.00 120.00 140.00 160.00 180.00 Q1 2016 Apr May
4 rigs 6 rigs 3 rigs
0.00 5.00 10.00 15.00 20.00 25.00 30.00 35.00 Q1 2016 Apr May Thousands
4 rigs 6 rigs 3 rigs
METRES/SHIFT vs PENETRATION RATE METRES DRILLED
ensuring no production disruptions for the client
April 2016
» Immediate uplift in rig performance » On track for a 20%+ increase in meters drilled, with less rigs
10
along with Capital’s senior management team
» Rig availabilities » Mechanical availabilities » Drilling performance » HSE performance » Down time
QUARTERLY PERFORMANCE REVIEWS ON MAJOR PROJECTS MECHANICAL AVAILABILITY UTILISATION STANDBY HOURS
100% 99% 99% 98% 96% 97% 100% 99% 99% 99% 98% 98% 60% 80% 100% Rig 96 Rig 97 Total Rig 96 Rig 97 Total Rig 96 Rig 97 Total Rig 96 Rig 97 Total Apr-15 May-15 Jun-15 Q2 KPI 83% 87% 85% 96% 95% 95% 90% 92% 91% 91% 92% 91% 60% 80% 100% Rig 96 Rig 97 Total Rig 96 Rig 97 Total Rig 96 Rig 97 Total Rig 96 Rig 97 Total Apr-15 May-15 Jun-15 Q2 KPI Toolbox/Safety meeting 21% Weather 2% Waiting for equipment/consumables 5% Waiting for fuel/refueling 1% Waiting for water/refilling 13% Decision/Drill Pads/Areas/Mark Up/Access 5% Travel / Waiting for people 38% Down Hole Issues 15%
11
TANZANIA
» Commenced operations in 2006 » Blast hole, grade control, exploration, delineation and underground drilling » Contract renewed in 2015 and runs to December 2020
MAURITANIA
» Commenced operations in 2010 » Exploration & delineation drilling » Contract renewed in 2015 and extended to December 2017
BOTSWANA
» Commenced operations in 2015 » Exploration & delineation drilling » Contract renewed in 2015 and runs to December 2016
EGYPT
» Commenced operations in 2005 » Blast hole, grade control & delineation drilling » Contract renewed in 2015 and runs to December 2020 » Commenced operations in 2008 » Blast hole and grade control drilling » Contract awarded in December 2015, runs to December 2019 (under 2nd year extension option)
12
» Africa » Strategic clients in other emerging economies
» Focus on multi-year blast hole and grade contracts and projects with
expansion opportunities
13
» Solid improvement in gold prices in 2016 » Improving levels of capital markets activity in the mining sector » Tendering enquiries picking up, particularly in the exploration sector
a very competitive pricing environment
shown solid success, in tendering & performance
» Stable long term production contracts » Streamlined cost structure & operating model » Conservative gearing, large available facility » Ample fleet capacity » Offering significant earnings leverage in an improved market
14
15
16
Revenue KPIs FY 2015 FY 2015 Normalised FY 2014 Change % Average Fleet Size 97 97 96 1 Fleet Utilisation (%) 34 34 43 (21) ARPOR ($) 188,000 188,000 188,000 Reported Earning FY 2015 FY 2015 Normalised FY 2014 Change % Revenue ($m) 78.7 78.7 98.8 (20) EBITDA ($m) 9.9 17.4 20.4 (51) EBIT ($m) (4.7) 2.8 3.9 (221) NPAT ($m) (10.2) (1.1) (0.6) 1,600 Basic EPS (cents) (7.6) (0.9) (0.4) (1,800) Diluted EPS (cents) (7.6) (0.9) (0.4) (1,800) Gross Profit (%) 28.4 36.1 33.4 (15) EBITDA (%) 12.6 22.1 20.7 (39) EBIT (%) (6.0) 3.6 4.0 (250) NPAT (%) (13.0) (1.4) (0.6) 2,067
»
Decrease attributable to lower utilisation
the exploration and delineation rigs
»
Maintained ARPOR despite pricing pressure, reflecting solid operational performance
»
Impacted by non-recurring adjustments totaling $7.5 million
»
Adjusted EBITDA of $17.4 million
»
Further non recurring adjustments through tax provisions of $1.6 million
»
Adjusted net loss of $1.1 million
»
Represents a 32% increase on the 2014 final dividend
17
history
tendering activity
UTILISATION (%)
decline
ARPOR (US$’000 PER MONTH)
‘000
and the North Mara Gold Mine (3)
FLEET GROWTH REVENUE (US$M)
Mara and an improving pipeline in exploration & delineation
11 19 25 49 60 74 85 93 95 96 94
20 40 60 80 100 Jan'06 Jan'07 Jan'08 Jan'09 Jan'10 Jan'11 Jan'12 Jan'13 Jan'14 Jan'15 Jan'16 74% 80% 76% 66% 46% 44% 38% 33% 35% 34% 20% 30% 40% 50% 60% 70% 80% 90% 100% Q1 12 Q2 12 Q3 12 Q4 12 Q1 13 Q2 13 Q3 13 Q4 13 Q1 14 Q2 14 Q3 14 Q4 14 Q1 15 Q2 15 Q3 15 Q4 15 Q1 16 36.00 43.06 40.92 38.91 38.34 34.35 21.73 21.85 26.12 27.68 23.63 21.50 19.12 19.83 20.85 18.90 19.10 5 10 15 20 25 30 35 40 45 50 Q1 12 Q2 12 Q3 12 Q4 12 Q1 13 Q2 13 Q3 13 Q4 13 Q1 14 Q2 14 Q3 14 Q4 14 Q1 15 Q2 15 Q3 15 Q4 15 Q1 16 US$ million 186 209 188 184 198 186 165 163 187 194 179 189 191 186 192 185 181 150 160 170 180 190 200 210 220 Q1 12 Q2 12 Q3 12 Q4 12 Q1 13 Q2 13 Q3 13 Q4 13 Q1 14 Q2 14 Q3 14 Q4 14 Q1 15 Q2 15 Q3 15 Q4 15 Q1 16
18
US$m US$m
GROSS PROFIT AND MARGINS EBITDA AND MARGINS MARGINS COMMENTARY
lower revenue in recent years
»
Reflective of continued focus on cost management
»
Non recurring charges
$5.1 million (non-cash)
$1 million
»
Non recurring charges
$1.4 million (non-cash)
COST MANAGEMENT
»
Relocation of Group Head office from Singapore to Mauritius
»
Strategic supply agreement; locked in pricing & supply agreements around key stock items
»
Travel consolidated under one global provider
41.1% 32.6% 32.6% 38.6% 36.3% 33.3% 35.2% 31.4% 28.1% 23.3% 34.5% 32.0% 34.5% 22.4%
0% 5% 10% 15% 20% 25% 30% 35% 40% 45% 0.0 5.0 10.0 15.0 20.0 25.0 30.0 H1 09 H2 09 H1 10 H2 10 H1 11 H2 11 H1 12 H2 12 H1 13 H2 13 H1 14 H2 14 H1 15 H2 15 GP (USDm) GP (%) Avg Margin
28.2% 18.8% 25.0% 27.3% 27.5% 24.9% 26.5% 20.2% 18.5% 8.1% 23.3% 17.2% 20.3% 5.0%
0.0% 5.0% 10.0% 15.0% 20.0% 25.0% 30.0% 0.0 5.0 10.0 15.0 20.0 25.0 H1 09 H2 09 H1 10 H2 10 H1 11 H2 11 H1 12 H2 12 H1 13 H2 13 H1 14 H2 14 H1 15 H2 15 EBITDA (USDm) EBITDA (%) Avg Margin
19
weaker revenue
comparable period, an improvement of 23.8%
inventory reduction
reduction & interim dividend
cash generation & working capital release
OPERATING CASH FLOW / FREE CASH FLOW FY 2015 NET CASH (DEBT) MOVEMENTS
Cash Flow
FY 2015 FY 2014 $m $m EBITDA 9.9 20.4 Non-cash expenses 1.5 0.7 Operating profit before working capital changes 11.4 21.1 Working capital changes 14.0 4.6 Cash generated from operations 25.4 25.7 Finance charges and tax payments (3.5) (3.0) Net cash generated from operating activities 21.9 22.7 Investing Activities Net cash used in investing activities (8.5) (13.6) Financing Activities Decrease in Loans (10.0) (6.2) Dividend paid (4.0)
(14.0) (6.2) Net (decrease) increase in cash (0.6) 2.8 Opening cash balance 14.7 12.4 Translation of foreign currency cash (0.7) (0.5) Closing cash balance 13.4 14.7
(20.0) (15.0) (10.0) (5.0) 0.0 5.0 10.0 15.0 20.0 Jun-10 Dec-10 Jun-11 Dec-11 Jun-12 Dec-12 Jun-13 Dec-13 Jun-14 Dec-14 Jun-15 Dec-15 Cash Generated from Operations Free Cash Flow
8.3
0.0 5.0 10.0 15.0 20.0 Opening Net Debt EBITDA Capex Working Capital Dividends Other Closing Net Cash
20
CAPITAL EXPENDITURE
US$m
» Geita Mine in Tanzania (AngloGold Ashanti): 1 rig » North Mara Mine in Tanzania (Acacia Mining): 3 rigs
refurbishments
Group maintenance strategy
with an average age of c5.6 years
1.0 6.2 12.4 15.9 2.6 10.7 3.4 7.4 12.7 14.3 14.1 1.7 2.9 4.5 0.0 5.0 10.0 15.0 20.0 25.0 30.0 FY 09 FY 10 FY 11 FY 12 FY 13 FY 14 FY 15 H1 Capex H2 Capex
Rig 70
RIG REBUILDS
Rig 59
Before After Before After
21
Balance Sheet FY 2015 FY 2014 Change $m $m % Cash and cash equivalents
13.4 14.7
(8.8) Investments
0.8 0.2
300.0 Receivables
13.7 17.8
(23.0) Inventory
17.6 22.7
(22.5) Property, plant and equipment
49.1 56.7
(13.4) Taxation
0.8 1.6
(50.0) Total Assets
95.4 113.6
(16.0) Payables
12.2 7.3
66.8 Borrowings
5.1 15.1
(66.2) Taxation
1.4 0.2
611.6 Total Liabilities
18.7 22.6
(17.3) Shareholder Equity
76.7 91.0
(15.7) Net Asset Value per share (cents) 57.0 67.6 (15.7) Net Cash (Debt) ($m)
8.3 (0.4)
2,175.0 Gearing (Net Cash (Debt) to Equity in %)
10.8 (0.4)
2,800.0 Return on Total Assets (%)
(4.5) 3.0
(236.4) Return on Invested Capital (%)
(6.8) (1.1)
518.2
GROSS DEBT vs NET (CASH) DEBT TO EQUITY (%)
» Net Debt to Equity decreased from 0.4% in 2014 to Net Cash to Equity of
10.8%
» Net cash at December 31 2015 of $8.3 million
» 2015 rig utilisation 34% (2014: 43%)
to $25m) & extending the tenure to January 2018
0.0% 10.0% 20.0% 30.0% 40.0% 50.0%
0.0 10.0 20.0 30.0 40.0 50.0 H1 09 H2 09 H1 10 H2 10 H1 11 H2 11 H1 12 H2 12 H1 13 H2 13 H1 14 H2 14 H1 15 H2 15 Total Debt Net debt/cash to Equity (%)
22
Strong balance sheet Investment Return excess to Shareholders through dividends
period)
» When determining the amount to be paid the Board will take into consideration the underlying profitability of the Company … and aim to approve an annual dividend within the range of 25-50% of the Company’s free cash flow (being operating cash flow less capital expenditure)”
committed to a strong balance sheet
23
24
QUALITY CLIENTS DEVELOPMENT & PRODUCTION FOCUS QUALITY ASSETS
& positive cash flows
(AngloGold Ashanti), North Mara (Acacia)
(development, grade control, blast hole, underground)
contributing 94% of 2015 revenue
by producing asset cash flows
0% 10% 20% 30% 40% 50% 60% 70% 80% 90% 100% 2008 2009 2010 2011 2012 2013 2014 2015 6% 33% 33% 22% 23% 39% 57% 77% 70% 54% 51% 66% 64% 56% 38% 17% 24% 13% 14% 7% 7% 3% 5% 6% 2% 5% 6% 2% Production Brownfields Greenfields Energy 0% 10% 20% 30% 40% 50% 60% 70% 80% 90% 100% 2008 2009 2010 2011 2012 2013 2014 2015 52% 53% 33% 63% 73% 58% 57% 54% 35% 41% 53% 30% 23% 39% 41% 41% 13% 6% 14% 7% 4% 3% 2% 5% Majors Mid-Tiers Juniors
25
SERBIA » Dundee MOZAMBIQUE » Boabab » Riversdale » Rio ERITREA » Andiamo » Chalice Gold » Sunridge ETHIOPIA » BHP » Ethiopia Potash PAKISTAN » Antofagasta » Barrick Gold ARMENIA » Lydian
2016 Active Locations Regional Offices Previous Registered Offices & Operations
BOTSWANA
GHANA » Kinross PNG & SOLOMONS » Allied Gold » Barrick Gold » Oil Search » St Barbara ZAMBIA » Albidon » Barrick Gold » Equinox » First Quantum » MMG » Omega DRC » Anvil » Tiger
TANZANIA
» Barrick Gold » Cradle » Glencore » IMX » Liontown » Magnis » Mantra » MMG » Rift Valley » Antofasgasta » BHP » CMP » Glencore » MMG » Polar Star
CHILE
PERU » BHP
EGYPT
» Gippsland » Thani Dubai (AngloGold Ashanti)
MAURITANIA
» Redblack » Knight Piesold
26
MACRO DRIVERS SHOWING MODEST IMPROVEMENT
*Source – SNL Metals & Mining 1. Source: Bloomberg (as at 11 March 2016)
GOLD1 COPPER1 EXPLORATION BUDGETS TREND
400 800 1,200 1,600 2,000 2002 2003 2004 2005 2006 2007 2008 2009 2010 2011 2012 2013 2014 2015 US$/troy oz Gold Spot 12-Month Trailing 2,000 4,000 6,000 8,000 10,000 12,000 2002 2003 2004 2005 2006 2007 2008 2009 2010 2011 2012 2013 2014 2015 US$/lb Copper Spot 12-Month Trailing
4,000 8,000 12,000 16,000 20,000 24,000 1997 1998 1999 2000 2001 2002 2003 2004 2005 2006 2007 2008 2009 2010 2011 2012 2013 2014 2015 Exploration Budget ($M)
27
EXTENSIVE INDUSTRY EXPERIENCE, SOLID COMPLEMENT OF SKILLS
»
Over 20 years experience in finance industry
»
Co-founder of Capital Drilling
»
Previously Executive Director and Head of Asian Equity Syndication and Corporate Broking at Macquarie Bank (HK)
Jamie Boyton Chairman
»
Over 30 years experience in the mining industry in Africa and Australia
»
Co-founder of Capital Drilling
»
Previous experience includes 6 years as
manager for Stanley Mining Services Tanzania (Layne Christensen)
Brian Rudd Director
»
Over 45 years experience in the natural resources sector
»
Ex President/CEO of Adastra
»
Ex Merrill Lynch Global Co- head of Mining Investment Banking
»
NED for several AIM/ASX/TSX mineral companies
Tim Read Senior NED
»
Over 35 years experience in mining
»
16 years at Barrick Gold; Executive VP of Exploration and Corporate Development
»
Ex NED for Highland Gold, now Namakwa Diamonds & NED of Yamana Gold
Alex Davidson NED
»
Over 25 years experience co-founding numerous development companies, with a focus on the resources, oil and gas, mining services and agribusiness sectors
»
Previously Executive Chairman and co-founder of Mirabela Nickel Ltd (ASX 200)
Craig Burton NED
EXECUTIVE DIRECTOR NON-EXECUTIVE CHIEF EXECUTIVE OFFICER
»
Over 35 years experience in Mining and the oil & gas industry
»
Previous executive positions in BHPB, Imdex Limited and Halliburton Energy Services.
»
Extensive international experience
Mark Parsons CEO
CHAIRMAN
28
CAPITAL STRUCTURE
Fully paid ordinary shares 134,603,681 Share price (as at 30 December 2015) USD 0.34 Market capitalisation (undiluted) ^ USD 45.80m Cash (as at 31 December 2015) USD 13.40m Debt (as at 30 December 2015) *includes bank borrowings & O/D USD 5.10m Enterprise Value USD 37.50m
Founding Shareholders 70% Free float 30% ^ Share options and unvested share grants issued 5.47m
SHAREHOLDING BLOCKS DIRECTORS AND SENIOR MANAGEMENT
Jamie Boyton Chairman Mark Parsons Chief Executive Officer Brian Rudd Executive Director Alex Davidson Non-Executive Director Craig Burton Non-Executive Director Tim Read Non-Executive Director David Payne Chief Operating Officer Jaco Brümmer Chief Financial Officer Tony Woolfe Group Asset Manager Graham Almond Group Manager, HR & Risk Jodie North Group Manager, Production Drilling Michele Butler Group Supply Manager Andy Topp Group Logistics Manager
NET ASSET VALUE PER SHARE vs SHARE PRICE
0.55 0.52 0.52 0.59 0.66 0.69 0.71 0.68 0.69 0.67 0.63 0.57 0.00 0.20 0.40 0.60 0.80 1.00 1.20 1.40 1.60 1.80 H1 10 H2 10 H1 11 H2 11 H1 12 H2 12 H1 13 H2 13 H1 14 H2 14 H1 15 H2 15 NAV per share Share Price in USD
29
ARPOR Average Revenue Per Operating Rig Capital Expenditure Cash used on acquisition of property plant and equipment less proceeds on disposals of property plant and equipment EBIT Earnings Before Interest and Taxes/Profit from operations EBITDA Earnings Before Interest, Taxes, Depreciation/Profit from
EPS Earnings Per Share Enterprise value Market capitalisation + Debt - Cash Free Cash Flow Operating cash flow (as defined above) less capital expenditure Group, Company Capital drilling and its subsidiaries KPI Key Performance Indicator HSE Health, Safety & Environmental LTI Loss Time Injury LTM Last Twelve Months Operating Cash flow Profit or loss after tax adjusted for non-cash items +/- the net change in working capital Operating Cash flow Margin Cash generated from operations / Sales MTI Medical Treatment Injury Net Debt Short Term and Long Term Debt including Bank Overdraft less Cash and Cash Equivalents NPAT Net Profit After Tax/Profit for the period (Headline) Revenue Average fleet size x Utilisation x ARPOR Return on capital employed (ROCE) LTM EBIT / (Average total assets – Average current liabilities) Return on Invested Capital (ROIC) LTM NOPAT / Average invested capital Return on Total Assets (ROTA) LTM EBIT / Average total assets Total assets Current assets plus non-current assets
The following words used in the presentation have the following meaning:
30
CAPITAL DRILLING LIMITED
Jamie Boyton
Chairman jamie.boyton@capdrill.com
Mark Parsons
Chief Executive Officer mark.parsons@capdrill.com
Mauritius
9th Floor, The CORE Ébène CyberCity Mauritius Telephone: +230-464 3250 www.capdrill.com
UK BROKER DETAILS
finnCap
60 New Broad Street, London EC2M 1JJ Telephone: +44 (0) 207 647 2800 Christopher Raggett CRaggett@finncap.com
UK PUBLIC RELATIONS
Buchanan
107 Cheapside, London EC2V 6DN Telephone: + 44 (0) 20 7466 5000 Bobby Morse bobbym@buchanan.uk.com