
SLIDE 1
Visuals for COS PT speech
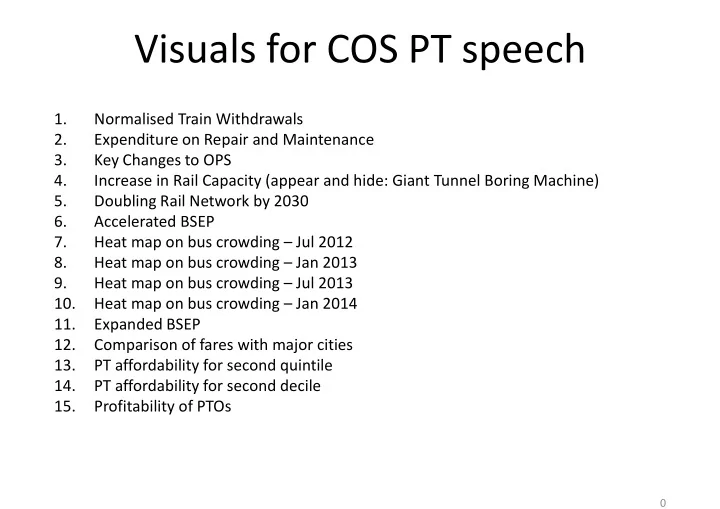
1. Normalised Train Withdrawals 2. Expenditure on Repair and Maintenance 3. Key Changes to OPS 3. Key Changes to OPS 4. Increase in Rail Capacity (appear and hide: Giant Tunnel Boring Machine) 5. Doubling Rail Network by 2030 6. Accelerated BSEP 7. Heat map on bus crowding – Jul 2012 8. Heat map on bus crowding – Jan 2013 9. Heat map on bus crowding – Jul 2013 10. Heat map on bus crowding – Jan 2014 11. Expanded BSEP 12. Comparison of fares with major cities 12. Comparison of fares with major cities 13. PT affordability for second quintile 14. PT affordability for second decile 15. Profitability of PTOs