
SLIDE 1
1
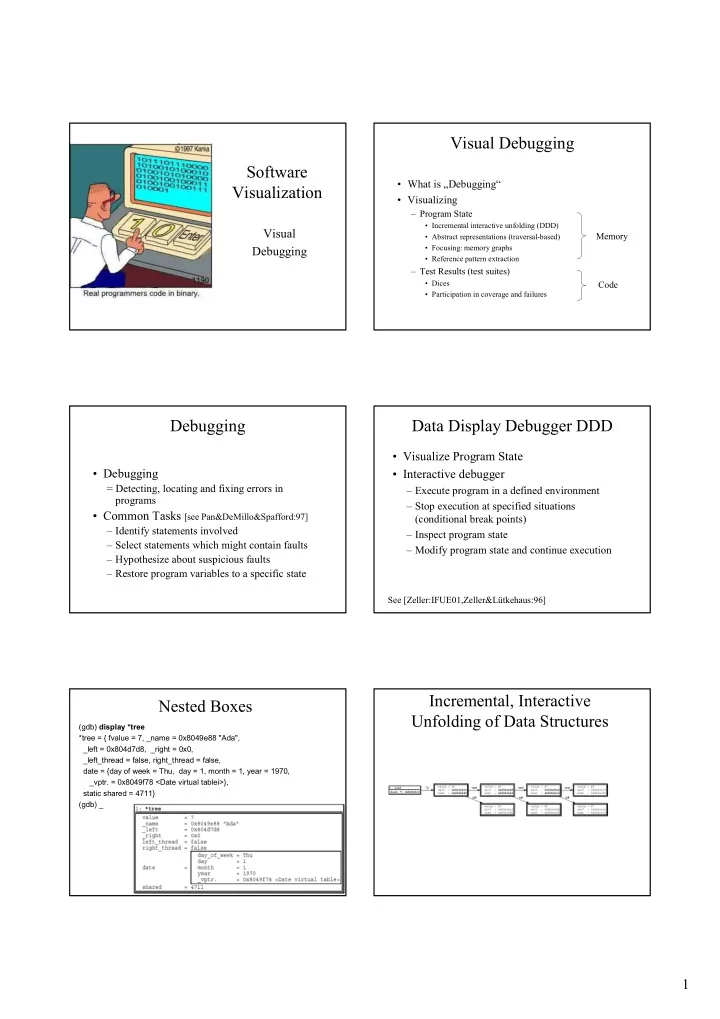
Software Visualization
Visual Debugging
Visual Debugging
- What is „Debugging“
- Visualizing
– Program State
- Incremental interactive unfolding (DDD)
- Abstract representations (traversal-based)
- Focusing: memory graphs
- Reference pattern extraction
– Test Results (test suites)
- Dices
- Participation in coverage and failures
Memory Code
Debugging
- Debugging
= Detecting, locating and fixing errors in programs
- Common Tasks [see Pan&DeMillo&Spafford:97]
– Identify statements involved – Select statements which might contain faults – Hypothesize about suspicious faults – Restore program variables to a specific state
Data Display Debugger DDD
- Visualize Program State
- Interactive debugger
– Execute program in a defined environment – Stop execution at specified situations (conditional break points) – Inspect program state – Modify program state and continue execution
See [Zeller:IFUE01,Zeller&Lütkehaus:96]
Nested Boxes
(gdb) display *tree *tree = { fvalue = 7, _name = 0x8049e88 "Ada", _left = 0x804d7d8, _right = 0x0, _left_thread = false, right_thread = false, date = {day of week = Thu, day = 1, month = 1, year = 1970, _vptr. = 0x8049f78 <Date virtual tablei>}, static shared = 4711} (gdb) _