
SLIDE 1
Vision to Actions South Slough NERR and Coos Watershed - - PowerPoint PPT Presentation
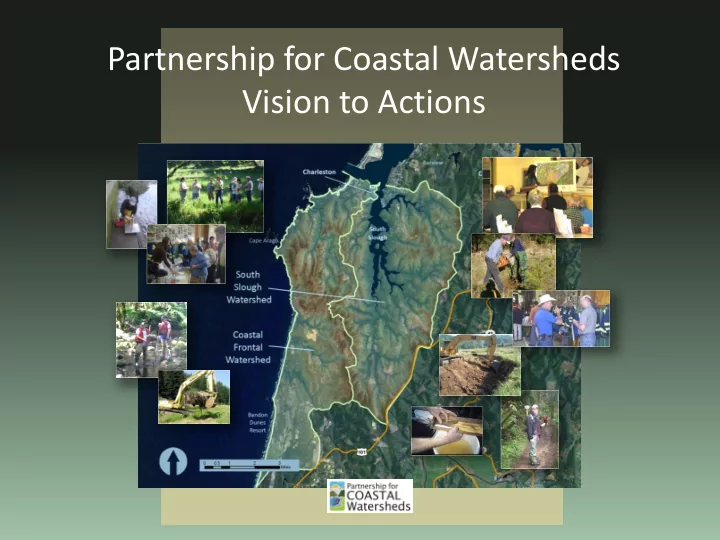
Partnership for Coastal Watersheds Vision to Actions South Slough NERR and Coos Watershed Association Monitoring Infrastructure (plus NOAA) Additional data from many partners: ODFW, DEQ, ODF, USFS, NAMPAN, NOAAetc. Water Habitat
Additional data from many partners: ODFW, DEQ, ODF, USFS, NAMPAN, NOAA…etc.
Water
Scorecard- Water
South Slough Estuary
completed)
completed) Habitat
Scorecard- Habitat
Habitat Inventory
Density
Area – not yet completed)
completed) Living Resources
Scorecard- Living Resources
completed)
Local Tide Height: Trend in
mean tide height recorded at NOAA’s tide station in Charleston
Summary: Based on 36
years of continuous tidal data, the mean tidal height at the Charleston tide station is rising at a rate of ~1.3 mm per year.
Why do we care: Sea level
rise will cause increased frequency of coastal flooding and associated erosion sometime in the future. This trend does not take into account the likelihood of sea level rise acceleration due to thermal expansion of the
Monitoring Effort: High Funding Source: NOAA
NOAA CO-OPS Tide Station
Climate: Local and regional
air temperature trends
Summary: Annual average
maximum temperatures in North Bend have dropped since 1902; the biggest drop being in summer max temps. Maximum temperatures have increased inland at Medford, OR.
Why do we care: The
temperature difference between the valley and the coast is a key controlling factor regulating summertime north winds on the coast. Strong north winds cause coastal upwelling which brings cool ocean waters to the surface along the coast, cooling coastal areas and frequently produces fog.
Monitoring Effort: High Funding Source: NOAA Weather Service
Medford
Pacific Decadal Oscillation (PDO) Cooling? PDO Warming? PDO Warming?
NOAA Weather Service stations, NB Airport, Medford
Invasive Species: Trends in
species invasions and eradication success
Summary: 2008 resource
condition assessment: “Alien species have caused or are likely to cause severe declines in some but not all ecosystem components and reduce ecosystem integrity. “
Why do we care: Invasive
species cause ecological and economic damage to natural and developed landscapes.
Invasive species are found throughout the project area.
Purple Loosestrife NZ Mud Snail Assiminea parasitologica Gorse
Land Use: Historic and
anticipated changes in land use in the project area
Summary: Nearly 85% of
all land in the partnership project area is zoned as either harvestable or conservation forest. Residential and commercial land each cover 5% while industrial zoning is the lowest land-use category represented, at 0.04%.
Why do we care: Zoning
boundaries indicate the current extent possible for different forms of
how different zones are geographically located and grouped, we can visualize maximum build-out scenarios in our community.
Climate Change
complexity using “climate-sensitive” species
tidal wetlands, eelgrass beds); protect vulnerable habitats (e.g., key habitats threatened by coastal erosion or disease)
the most likely local effects of climate change; assess local “vulnerabilities”
Climate Change
complexity using “climate-sensitive” species
tidal wetlands, eelgrass beds); protect vulnerable habitats (e.g., key habitats threatened by coastal erosion or disease)
the most likely local effects of climate change; assess local “vulnerabilities”
Land Use (historic)
contaminants
*Includes invasive species
Climate Change
complexity using “climate-sensitive” species
tidal wetlands, eelgrass beds); protect vulnerable habitats (e.g., key habitats threatened by coastal erosion or disease)
the most likely local effects of climate change; assess local “vulnerabilities”
Land Use (historic)
contaminants
Land Use (developing/anticipated)
*Includes invasive species